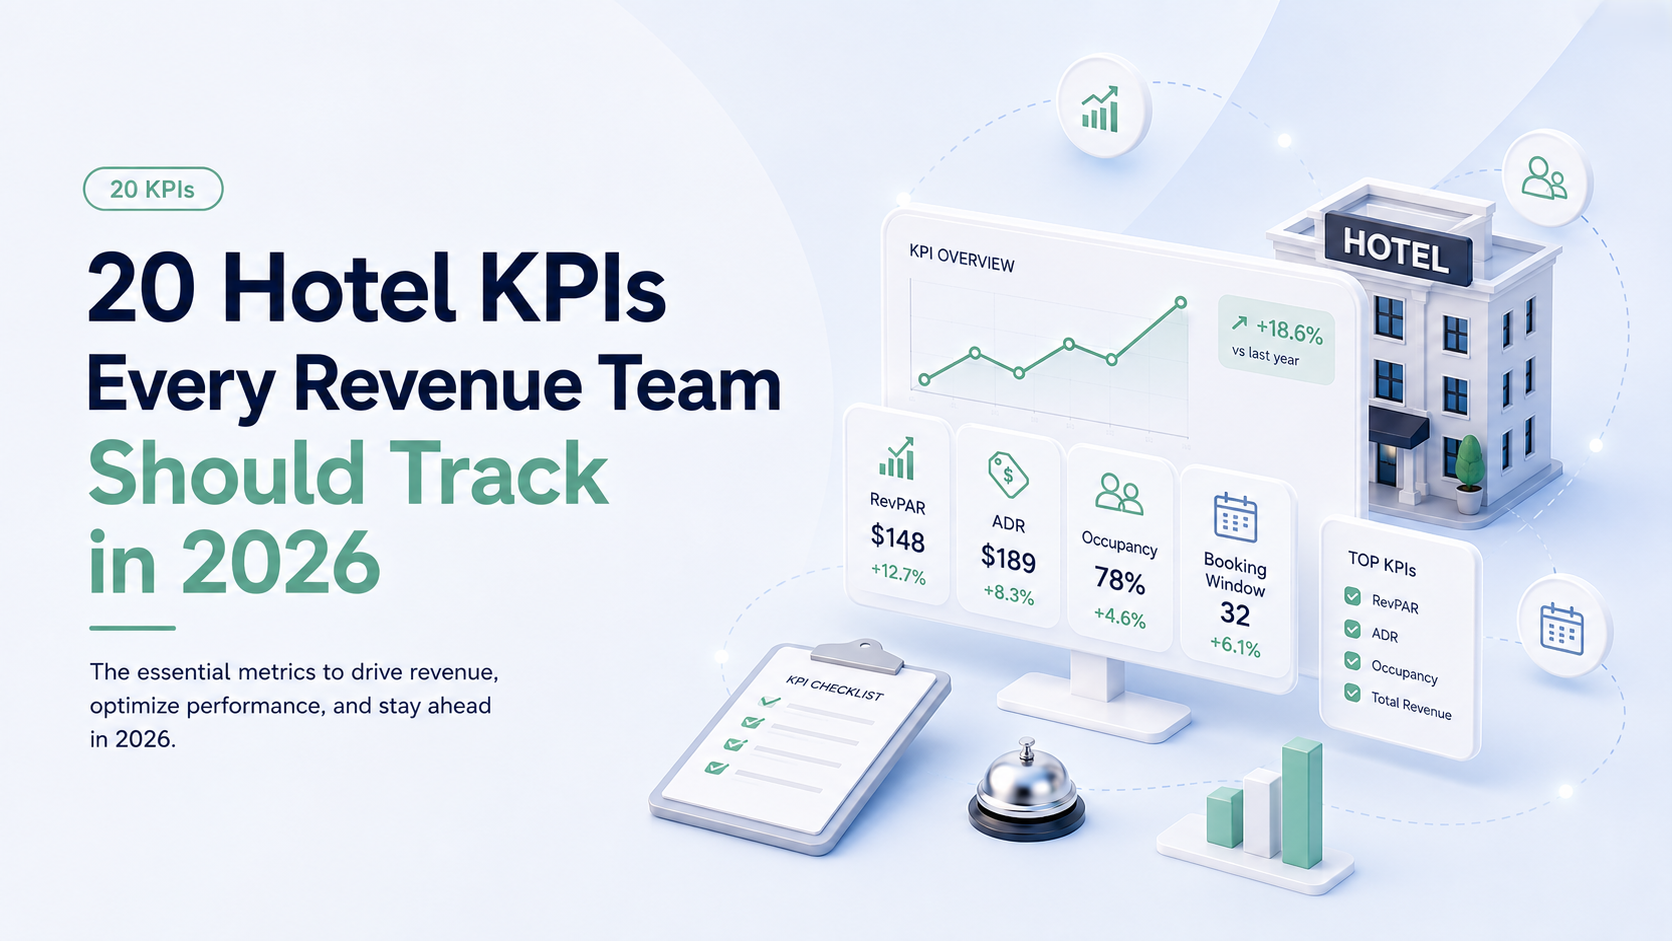
QUICK ANSWER — The core hotel KPIs are Occupancy, ADR, and RevPAR for top-line performance; TRevPAR and GOPPAR for total revenue and profit; RGI, MPI, and ARI for market share against a comp set; and pickup, booking pace, and cost of acquisition for forward demand and channel efficiency. Beyond those, the metric that matters depends on the role reading it and the cadence it is reviewed at.
Most hotel dashboards show about forty numbers and drive roughly four decisions. The problem is rarely that a property tracks too little — it is that nobody has decided which metrics belong to which person, on which day, for which purpose.
This is the metric list. For how to turn these numbers into decisions, see our data analytics guide. Here we cover what each of the twenty KPIs measures, how it is calculated, what it will not tell you, and where to read more — plus the two things most KPI lists skip: how often to review each one, and which role should own it.
Our dashboard has 40 widgets. I look at three. Nobody has ever asked me about the other 37 and I’m fairly sure nobody looks at them either.
Key takeaways
- Twenty KPIs, six questions. Group them by what they answer — revenue, profit, share, demand, distribution, operations — not by where they appear on a dashboard.
- The core metrics build on each other: Occupancy × ADR = RevPAR, plus ancillary = TRevPAR, minus operating costs = GOPPAR.
- Cadence matters as much as the metric. Three KPIs deserve daily attention; most belong on a monthly review.
- The same twenty metrics rank differently for a revenue manager, a GM, an asset manager, and an owner.
- Several of these can be gamed. Occupancy and RevPAR both improve under discounting that damages profit — which is why they are never read alone.
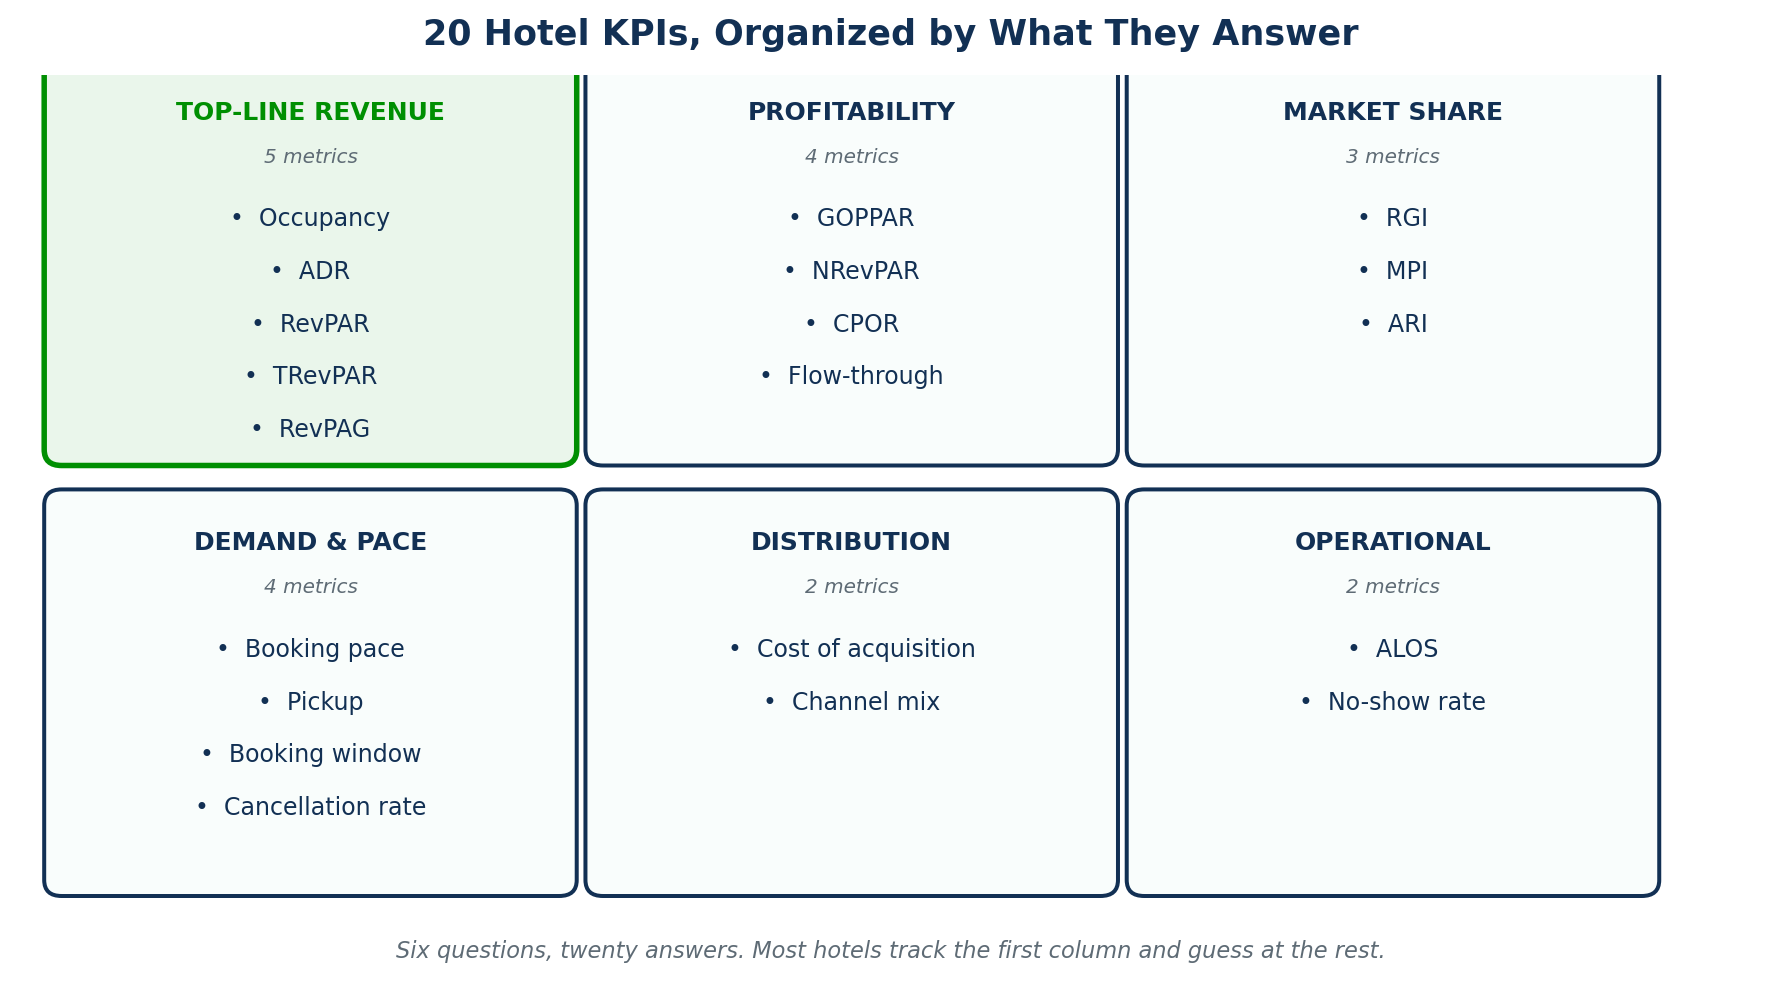
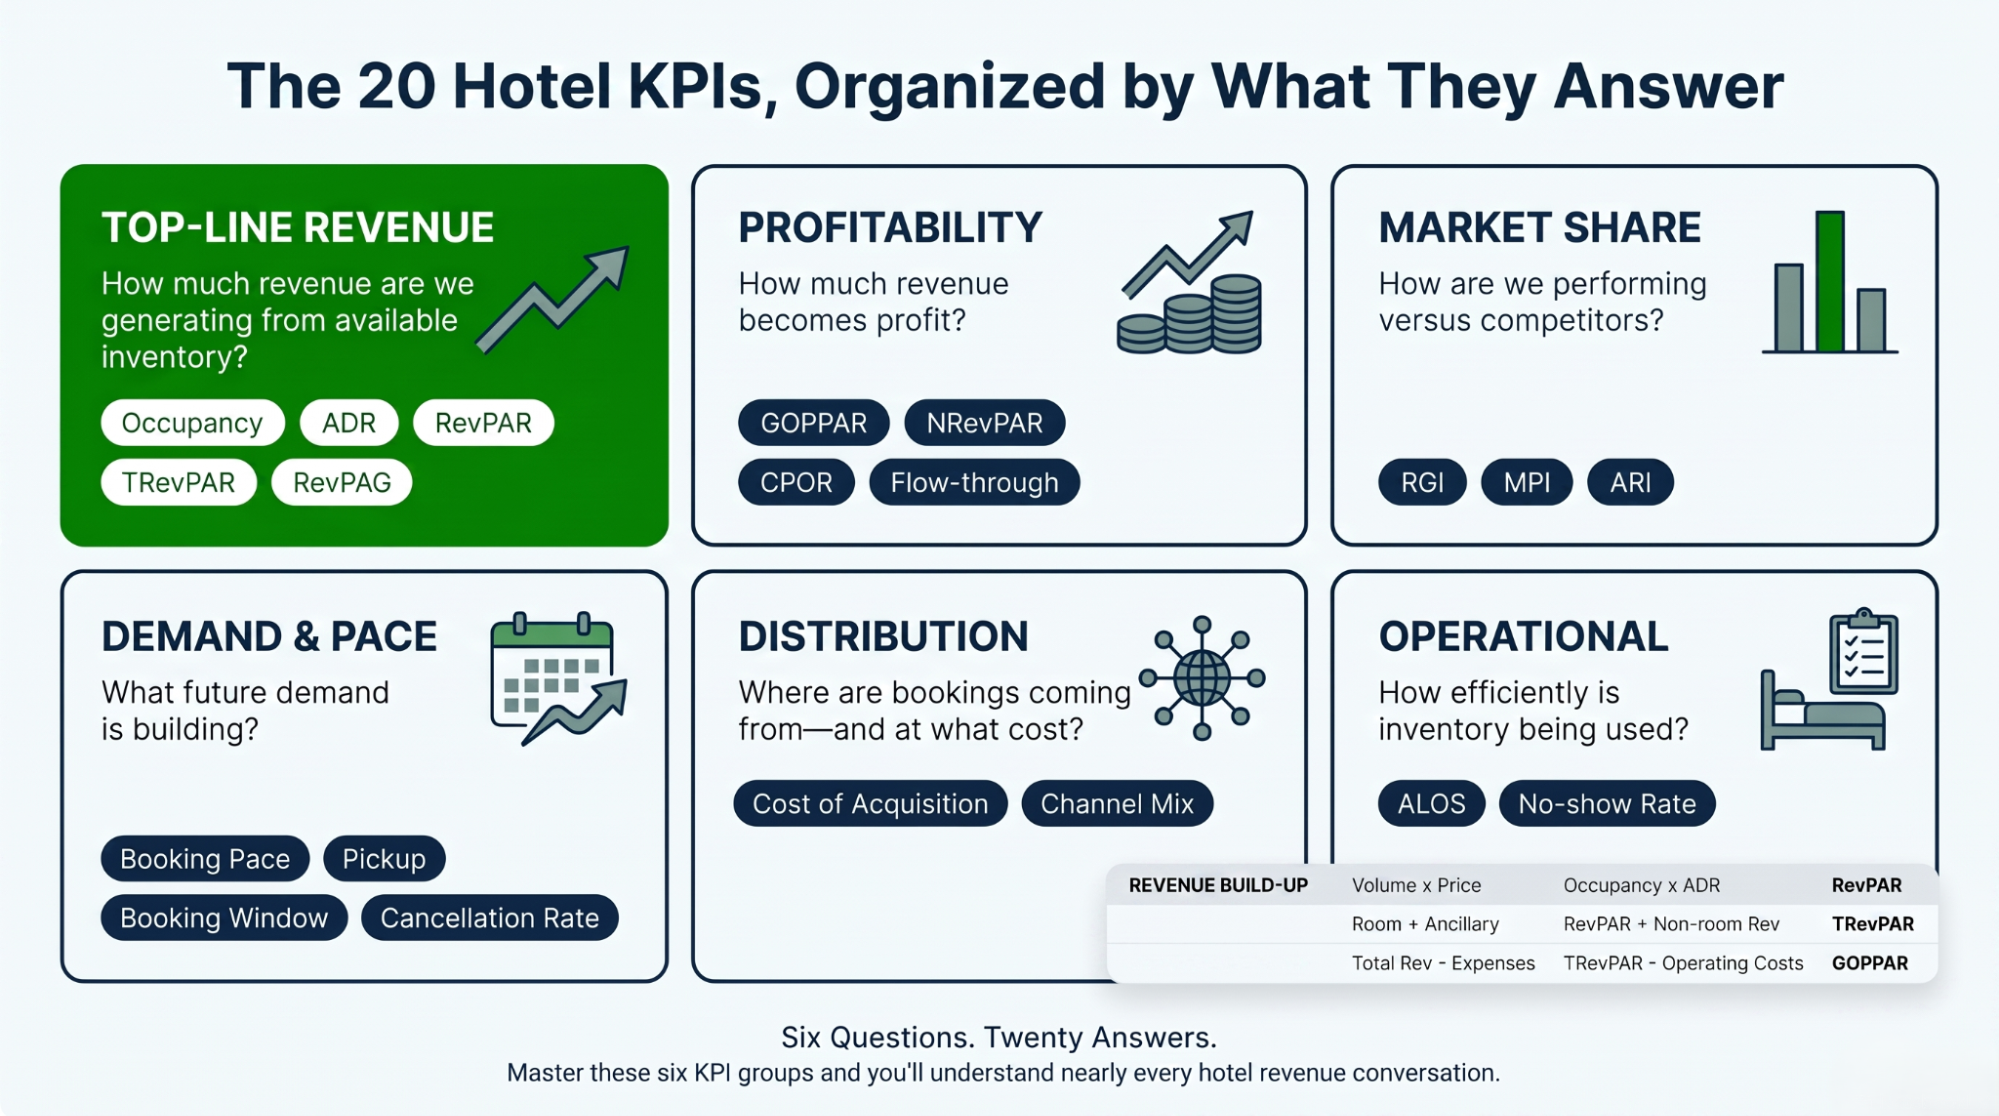
The 20 KPIs, Organized by What They Answer
A list of metrics in alphabetical order is a glossary, not a framework. Grouped by the question each one answers, the same twenty become usable.
How the Core Metrics Build on Each Other
Before the list, the structure. Five of these are not independent measurements — they are layers of the same calculation, each one adding something the previous one ignored.
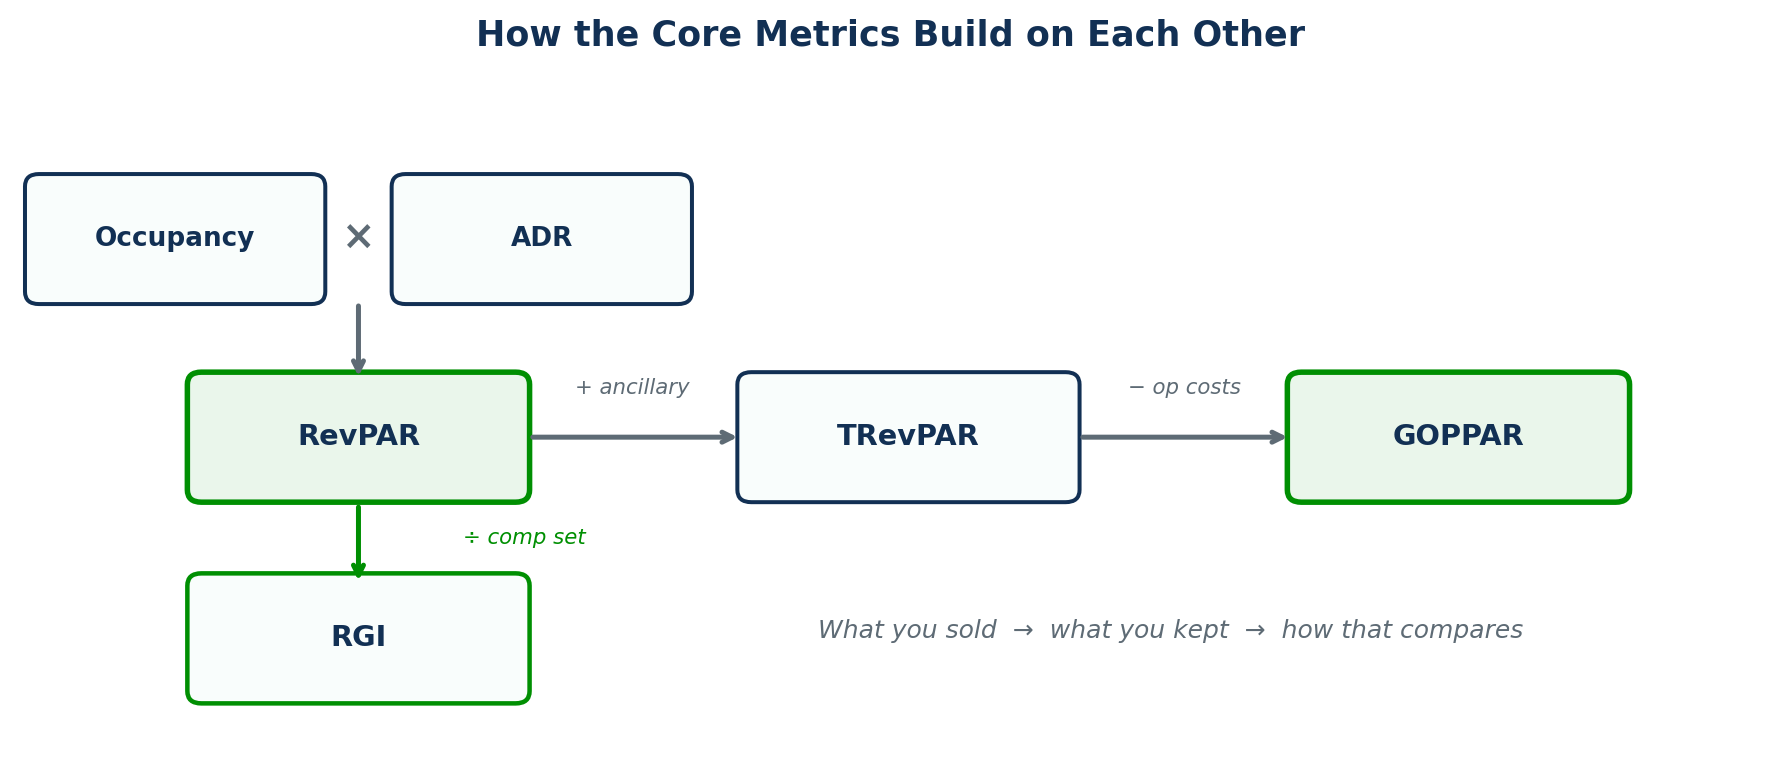
Occupancy and ADR multiply into RevPAR. RevPAR plus non-room revenue becomes TRevPAR. Subtract operating costs and you reach GOPPAR, the number an owner actually banks. Divide any of them by your comp set’s equivalent and you get an index — RGI, MPI, ARI — which tells you whether the absolute number was good. Understanding that chain is what stops a team celebrating a metric that improved for the wrong reason.
Group 1: Top-Line Revenue (5 KPIs)
1 · Occupancy Rate
Formula: (Rooms Sold ÷ Rooms Available) × 100
The percentage of your inventory that sold. The most intuitive metric and the most misread, because it ignores price entirely — any property can hit 95% by pricing low enough. Read it beside ADR, always. Watch the denominator: out-of-order rooms usually stay in it, and switching that basis mid-year breaks your trend line. Full guide to occupancy rate →
2 · ADR (Average Daily Rate)
Formula: Room Revenue ÷ Rooms Sold
Average revenue per occupied room. Measures pricing on rooms you sold and ignores the ones you did not. Excludes complimentary, staff, and out-of-order rooms. Its most common trap: ADR moves when segment mix shifts even if no rate changed, which sends teams chasing a pricing problem that does not exist. Full guide to ADR →
3 · RevPAR (Revenue Per Available Room)
Formula: Room Revenue ÷ Rooms Available · or ADR × Occupancy
The headline scoreboard, and the metric that settles the occupancy-versus-rate argument. Counts every room whether it sold or not, which is why it captures what occupancy and ADR each miss on their own. Can still be gamed by short-term discounting, and says nothing about what the revenue cost to generate. Full guide to RevPAR →
4 · TRevPAR (Total Revenue Per Available Room)
Formula: Total Revenue ÷ Rooms Available
RevPAR extended to every revenue stream — rooms plus F&B, spa, parking, meeting space, ancillaries. For full-service properties and resorts it is often more meaningful than RevPAR, because a large share of the earning capacity sits outside the room rate. For select-service, it tracks RevPAR closely and adds little. Full guide to TRevPAR →
5 · RevPAG (Revenue Per Available Guest)
Formula: Total Revenue ÷ Number of Guests
Revenue generated per guest rather than per room. Useful where occupancy per room varies — resorts, extended stay, properties with significant double occupancy — because two guests in one room consume and spend differently from one. Rarely a headline metric, but it exposes ancillary performance that TRevPAR averages away across empty rooms.
Group 2: Profitability (4 KPIs)
6 · GOPPAR (Gross Operating Profit Per Available Room)
Formula: Gross Operating Profit ÷ Rooms Available
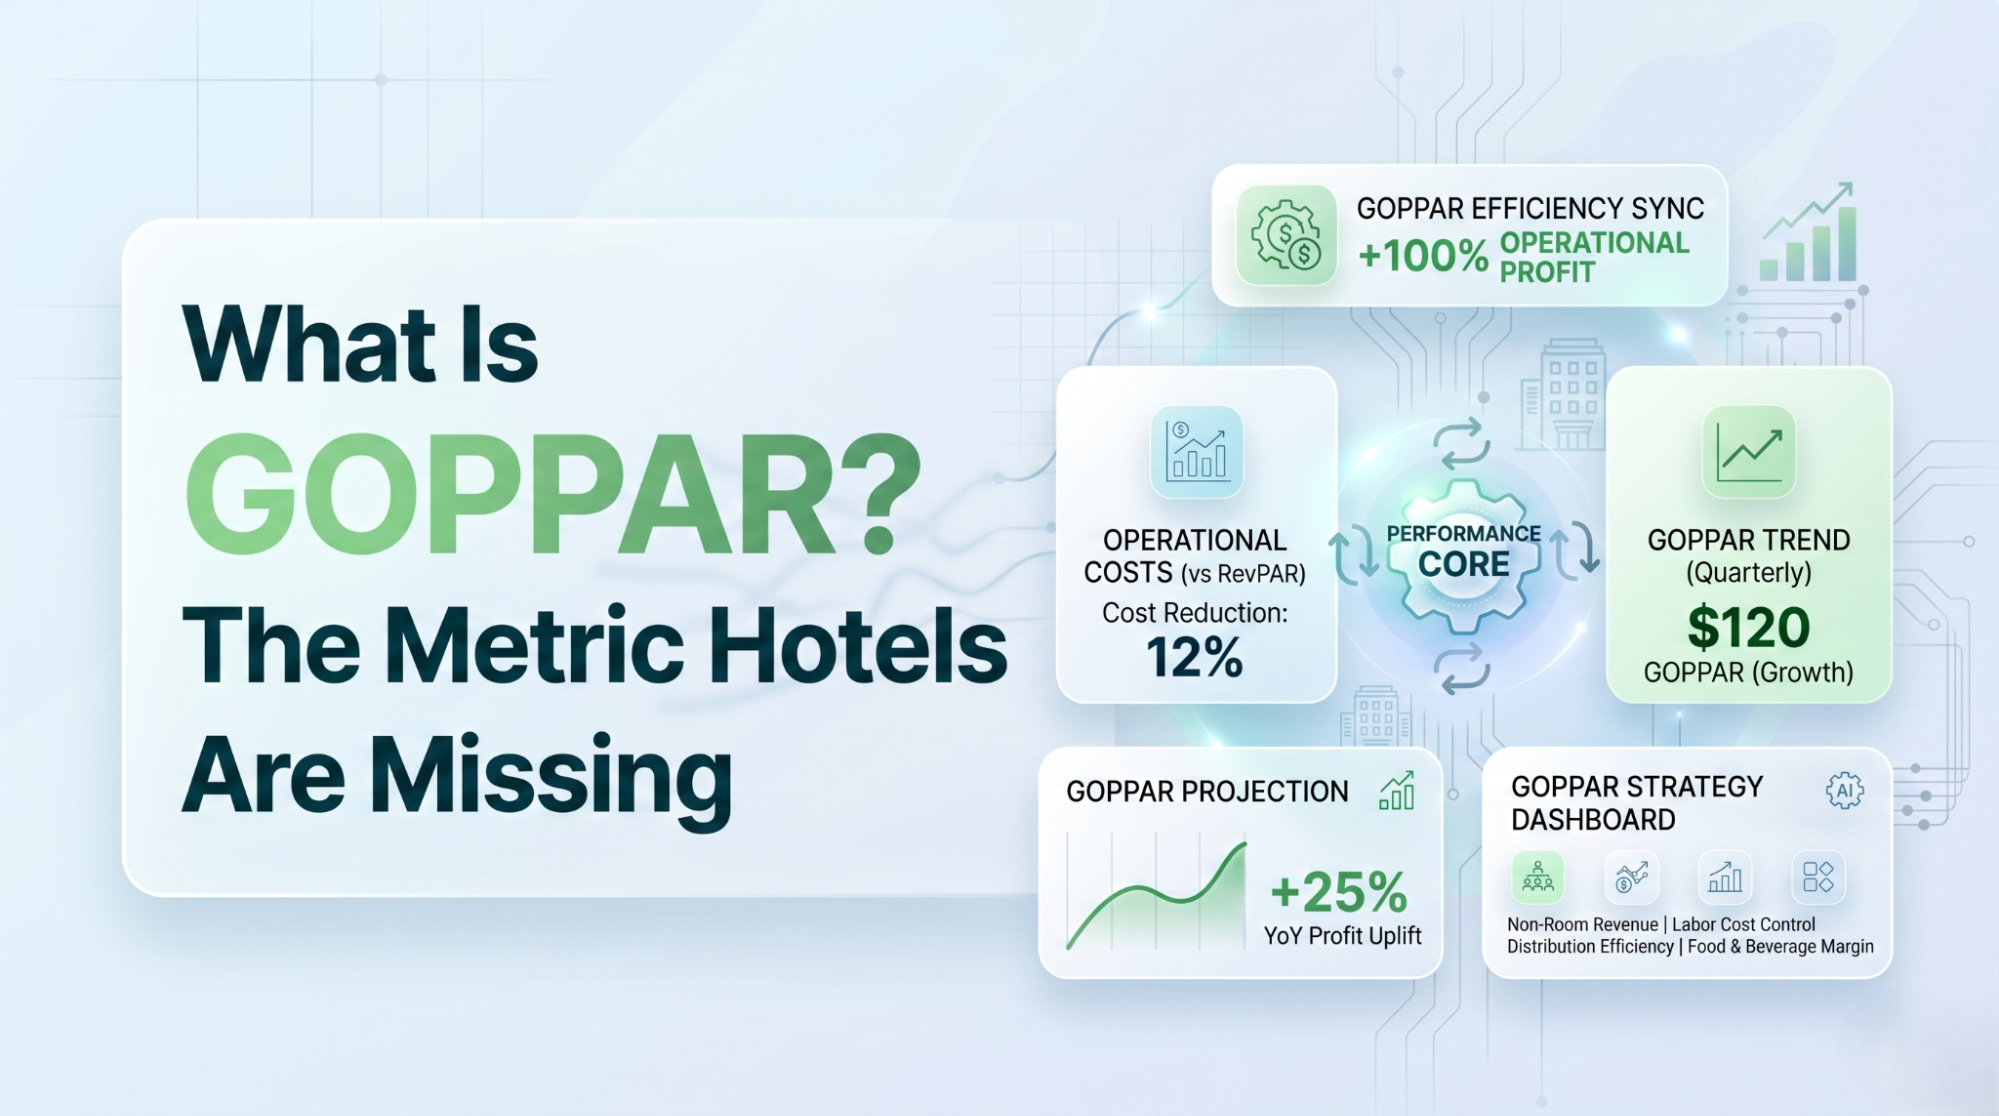
What actually reaches the owner after operating costs. The metric asset managers and lenders care most about, because RevPAR can rise while GOPPAR falls — more occupancy means more housekeeping, more covers, more wear. If you report one profitability number upward, report this one. Full guide to GOPPAR →
7 · NRevPAR (Net Revenue Per Available Room)
Formula: (Room Revenue − Distribution Costs) ÷ Rooms Available
RevPAR after the cost of acquiring the booking — commissions, channel fees, acquisition spend. It is the bridge between top-line and profit, and it reorders your channels. A high-volume OTA can deliver strong RevPAR and mediocre NRevPAR. If your channel reporting shows gross revenue only, this is the number it is hiding.
8 · CPOR (Cost Per Occupied Room)
Formula: Total Operating Costs ÷ Rooms Sold
What it costs to service one occupied room — housekeeping, amenities, utilities, laundry, allocated labour. Sets the floor beneath which selling a room destroys value rather than creating it. Most properties can quote their ADR instantly and have no idea what their CPOR is, which makes distressed-date pricing guesswork.
9 · Flow-Through
Formula: (Change in GOP ÷ Change in Revenue) × 100
How much of each incremental revenue dollar reaches gross operating profit. A property with 50% flow-through converts half of new revenue into profit; one at 20% is working much harder for the same result. Ownership groups watch this closely because it measures operating leverage rather than sales performance.
Group 3: Market Share (3 KPIs)
10 · RGI (Revenue Generation Index) · RevPAR Index
Formula: (Your RevPAR ÷ Comp Set RevPAR) × 100
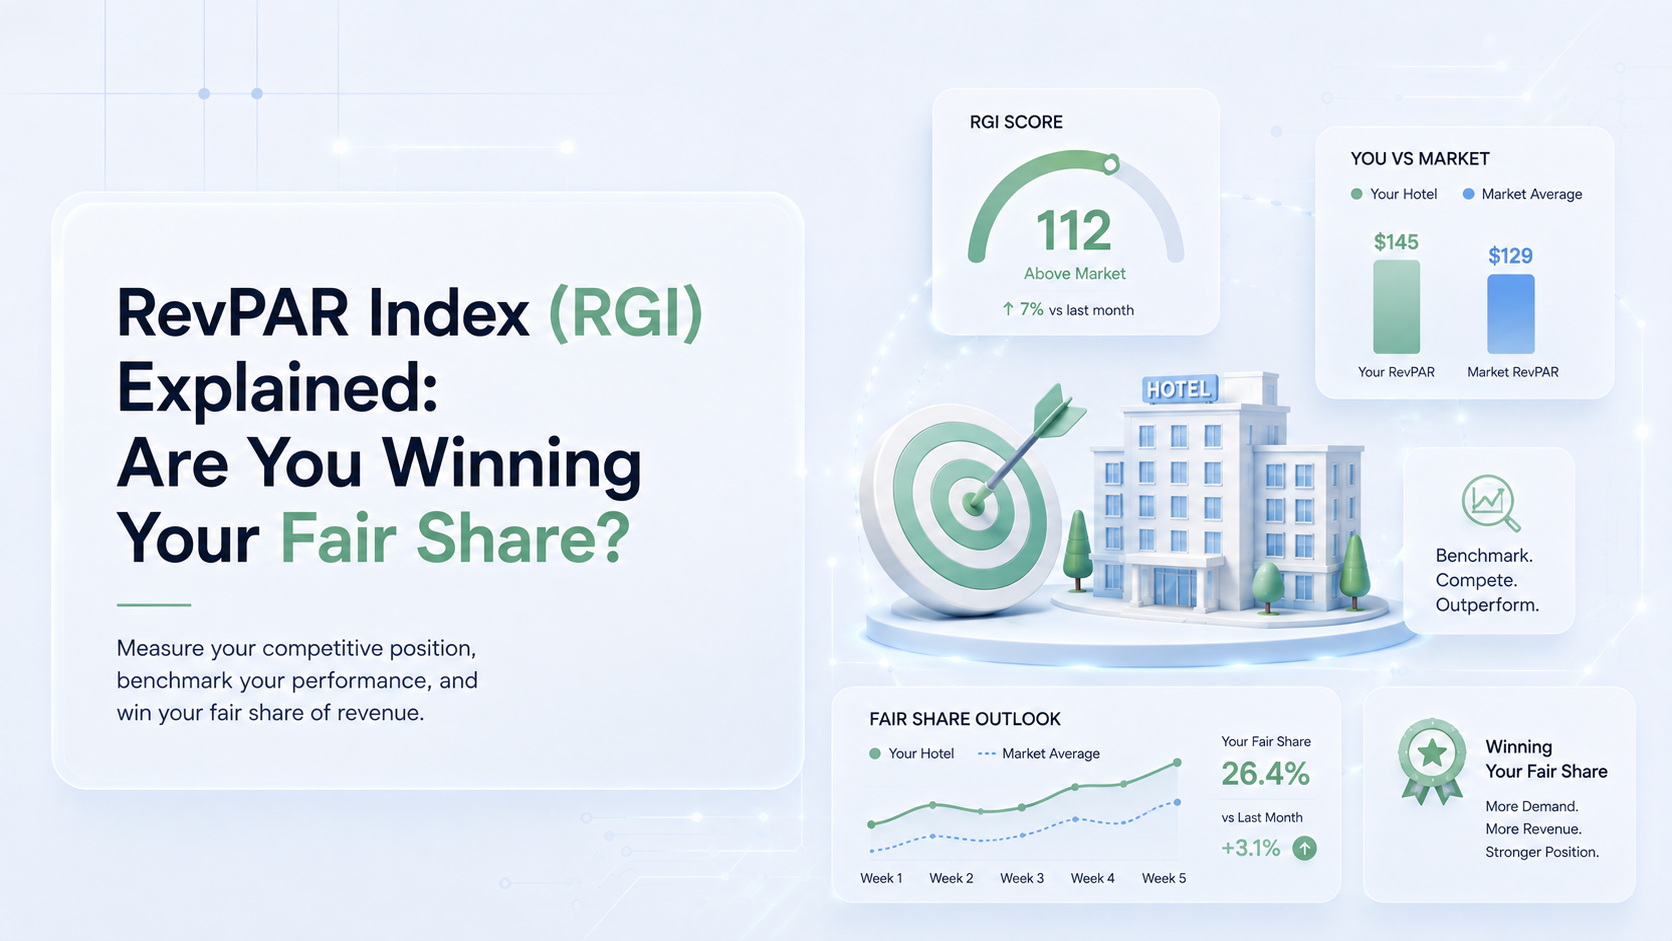
Whether you captured your fair share of market revenue. 100 means exactly the share your room count entitles you to. It strips out the market, which is why it appears in management agreements — absolute RevPAR moves with the economy, RGI isolates the part you controlled. Full guide to RevPAR Index →
11 · MPI (Market Penetration Index)
Formula: (Your Occupancy ÷ Comp Set Occupancy) × 100
Your occupancy share against the comp set. Above 100 means you are filling more rooms than your inventory entitles you to. On its own it flatters volume-led strategies; paired with ARI it becomes diagnostic. High MPI with low ARI is the most common and most expensive pattern in benchmarking — winning occupancy by underpricing.
12 · ARI (Average Rate Index)
Formula: (Your ADR ÷ Comp Set ADR) × 100
Your rate position relative to the set. Below 100 means you are cheaper than your competitors, which may be strategy or may be leakage. The only way to tell is RGI: if rate positioning is deliberate and working, the revenue index holds above 100 despite the lower ARI.
Group 4: Demand & Pace (4 KPIs)
13 · Booking Pace
Formula: On-the-books this year vs same point last year
How your bookings for a future date are accumulating compared with the equivalent point in a prior period. The single most forward-looking number in the list — it flags a soft date while there is still time to price it differently. Everything else in this article describes what already happened.
14 · Pickup
Formula: Rooms added since the last measurement point
New bookings gained over a defined window — typically since yesterday, last week, or the same point last month. Where pace shows the position, pickup shows the velocity. A date can be behind on pace but picking up fast, which is a different situation from one that is behind and flat.
15 · Booking Window (Lead Time)
Formula: Average days between booking date and arrival date
How far ahead guests commit. It differs sharply by segment and channel, and shifts in it are an early warning: a shortening window means demand is arriving later, which changes when you should be pricing rather than what you should charge. Track the trend, not the single-period number.
16 · Cancellation Rate
Formula: (Cancelled Bookings ÷ Total Bookings) × 100
The share of bookings that never become stays. Rates vary materially by channel and rate plan, which means a channel’s booking volume overstates its value. Track it per channel and per rate plan, and run your channel profitability analysis on realised stays rather than reservations.
Group 5: Distribution (2 KPIs)
17 · Cost of Acquisition
Formula: Total Distribution & Acquisition Cost ÷ Bookings (or as % of revenue)
What it costs to win a booking, including commission, advertising spend, booking engine fees, and loyalty cost. The number that turns channel debates from opinion into arithmetic. Worth calculating per channel, and worth noting that direct is cheaper but not free once paid search and programme costs are counted.
18 · Channel Mix
Formula: Share of room nights by distribution channel
The distribution of your business across direct, OTA, GDS, wholesale and the rest. There is no universal target — a strong mix for a resort is unreachable for an independent boutique in a secondary market. Judge it on net contribution rather than direct share, because direct share is a proxy and proxies get gamed. Full guide to distribution channels →
Group 6: Operational (2 KPIs)
19 · ALOS (Average Length of Stay)
Formula: Total Room Nights ÷ Total Bookings
The average number of nights per booking. Longer stays reduce turnover cost per night and stabilise occupancy, which is why length-of-stay controls are a pricing lever rather than an operations detail. A falling ALOS raises your effective CPOR even when occupancy holds steady.
20 · No-Show Rate
Formula: (No-Shows ÷ Confirmed Arrivals) × 100
Guests who neither arrive nor cancel. Distinct from cancellations because you had no opportunity to resell the room. It is the input that makes overbooking defensible: without a reliable no-show rate, an overbooking policy is a gamble rather than a calculation.
How Often to Review Each One
The second thing most KPI lists omit. A metric reviewed at the wrong frequency is either noise or a missed opportunity, and both failures look like diligence.
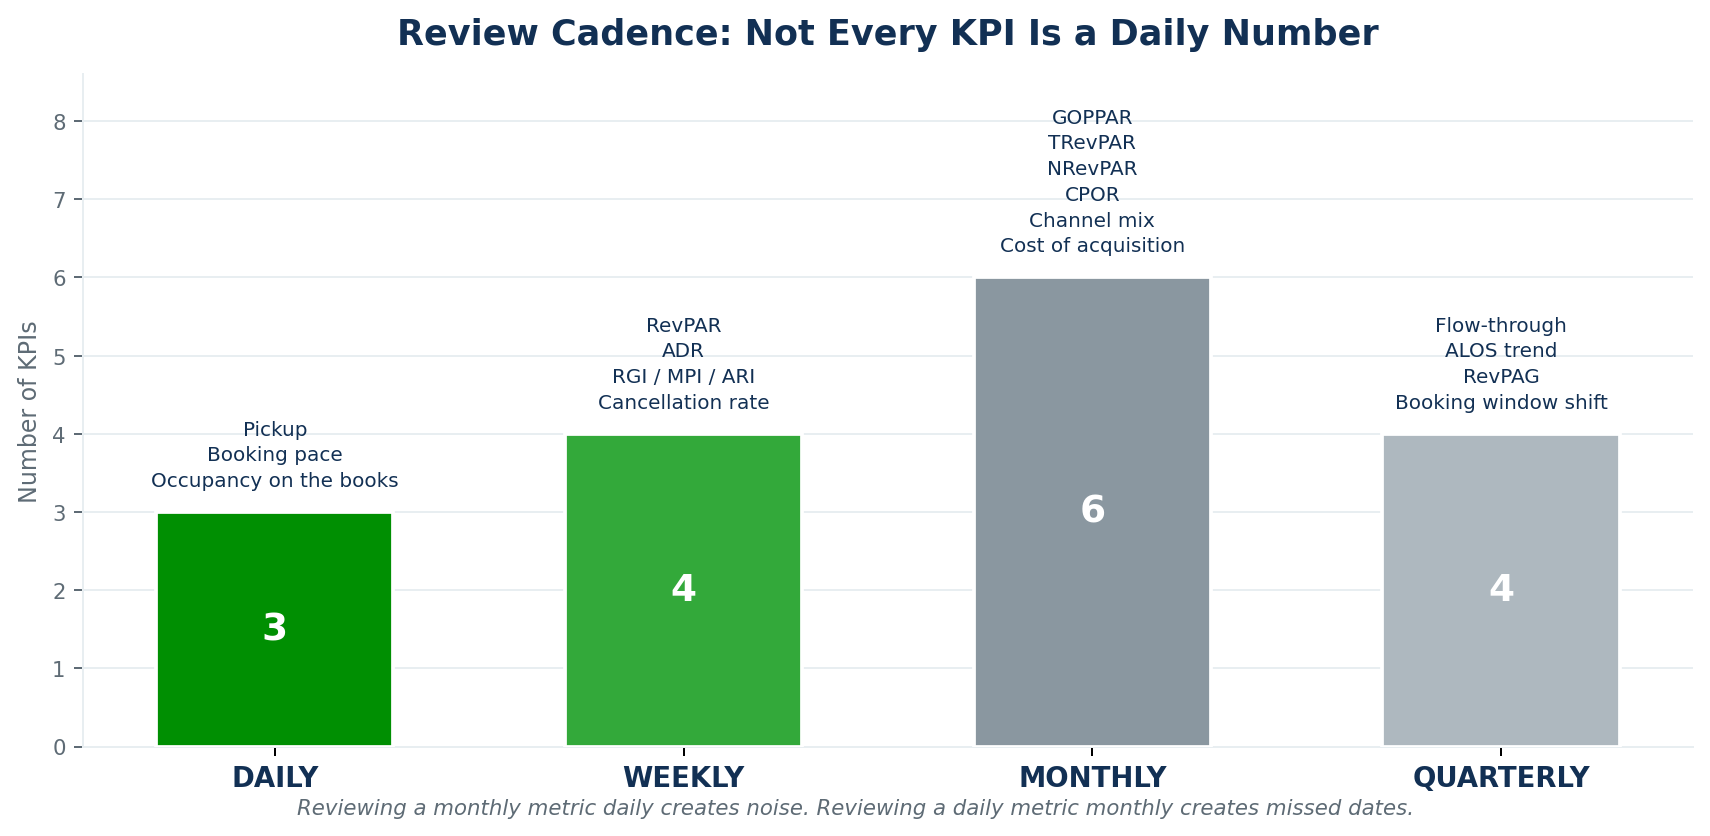
Only three of the twenty genuinely warrant daily attention, and they are the forward-looking ones — pickup, pace, and on-the-books occupancy — because they are the only numbers you can still act on. Weekly belongs to RevPAR, ADR, the index family, and cancellation rate: enough signal to see a pattern, not so much that a single group block reads as a trend.
Monthly is where profitability lives, since GOPPAR, NRevPAR, CPOR and channel economics need a closed accounting period to be meaningful. Quarterly suits the structural metrics — flow-through, ALOS trend, booking-window shift — which move slowly and mislead badly when read over short windows.
Who Should Be Watching What
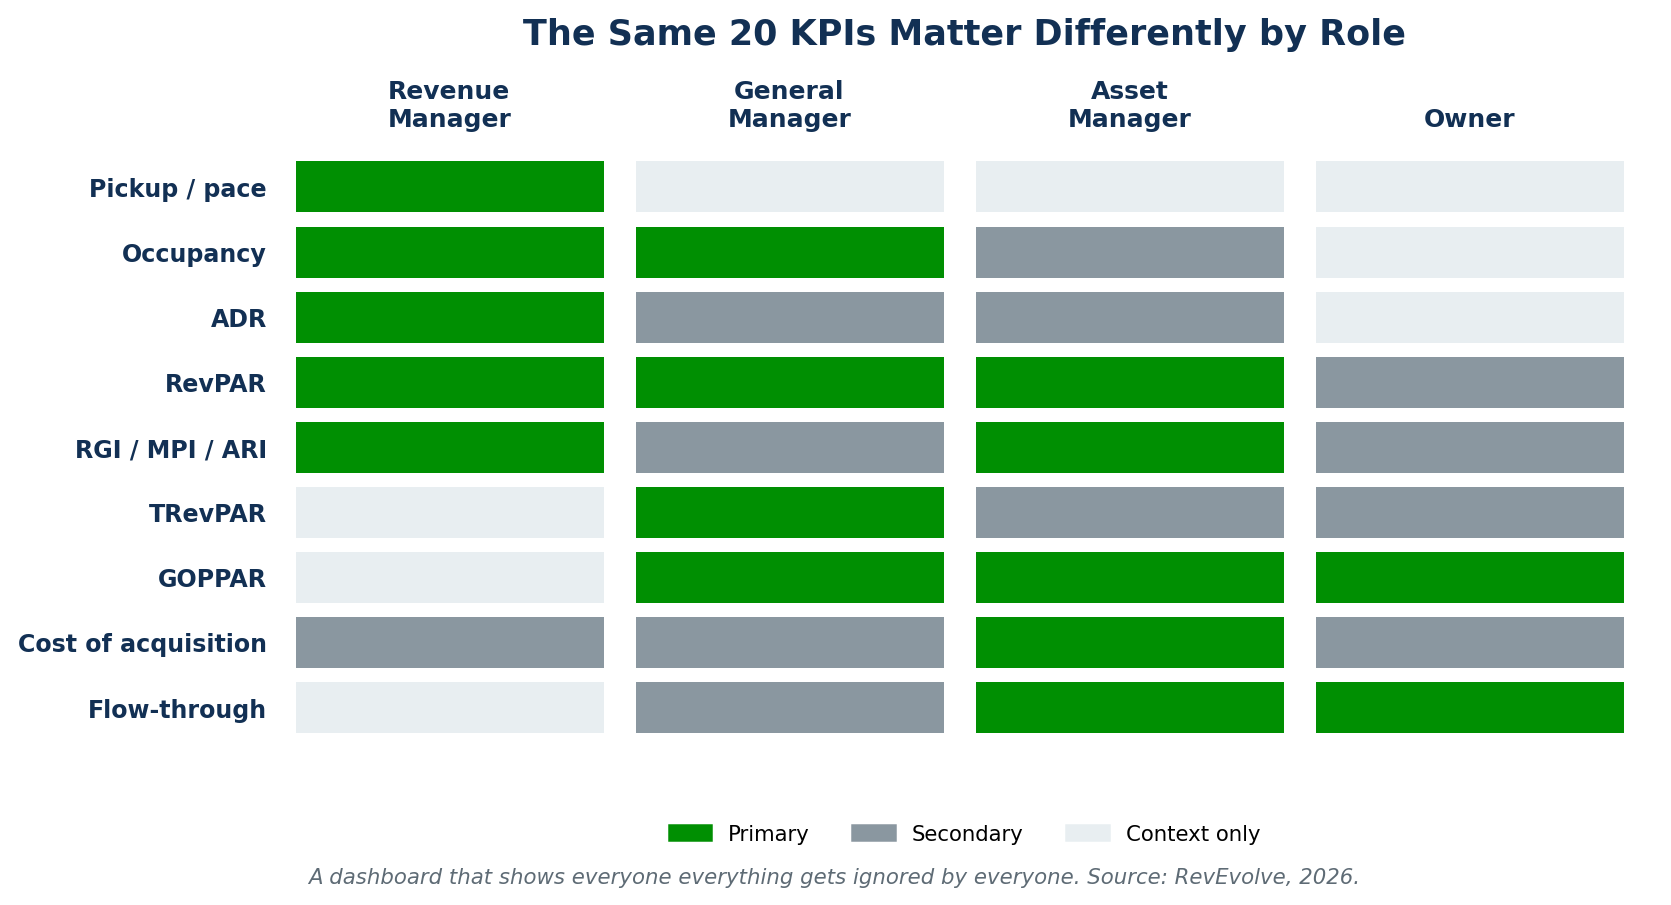
A dashboard that shows everyone everything gets ignored by everyone. The same twenty metrics carry very different weight depending on who is reading them.
Revenue Manager
Lives in pickup, pace, occupancy, ADR and the index family. These are the metrics attached to decisions they can still make. GOPPAR is context, not a working number — by the time it lands, the pricing decisions that produced it are months old.
General Manager
Balances top-line against guest experience and cost. RevPAR, occupancy, TRevPAR and GOPPAR are the working set, with the revenue detail delegated. The GM question is whether the property is performing overall, not which Tuesday was underpriced.
Asset Manager
Cares about consistency and comparability across properties. RGI, GOPPAR, flow-through and cost of acquisition dominate, because those are the numbers that survive comparison between a 90-room select-service and a 300-room full-service asset.
Owner
GOPPAR and flow-through, essentially. Everything else is diagnostic detail that explains those two. An owner report leading with occupancy is answering a question the owner did not ask.
The Metrics That Can Be Gamed
Worth naming plainly, because targets attached to these produce predictable distortions.
Occupancy improves whenever you drop rate far enough, which is why an occupancy target without a matching rate floor is an instruction to discount. RevPAR is more robust but still moves on short-term discounting that damages GOPPAR. Direct booking share can be bought through paid search that costs nearly as much as the commission it replaced, so the percentage improves while margin does not. And any index — RGI, MPI, ARI — can be flattered by a comp set chosen for comfort rather than accuracy.
Building a KPI Set That Actually Gets Used
- Start with five, not twenty. Occupancy, ADR, RevPAR, RGI, GOPPAR covers most decisions. Add the rest when the team can act on them.
- Give every metric an owner. An unowned number on a dashboard is decoration.
- Match the cadence to the metric, not to the meeting schedule.
- Pair every volume metric with a value metric. Occupancy with ADR. Bookings with cost of acquisition. Never one alone.
- Report net wherever possible. If leadership sees gross, gross is what gets managed.
- Make every number comparable across properties before you compare properties. Different definitions produce confident nonsense.
From Twenty Numbers to One Decision
The honest limitation of any KPI list is that measurement and decision-making are different activities. Twenty metrics tell you the state of the property with considerable precision. None of them tell you what to charge on a specific date.
That gap is where a revenue system works. RM Copilot reads these metrics across your PMS data, analyzes demand and pace per date, and recommends the pricing action with the reasoning attached — then lets your team simulate the projected occupancy, ADR and revenue impact before committing. Your team reviews the recommendation and applies it.
Across a portfolio the same logic addresses the comparability problem: when every property’s metrics are normalized to one definition and one refresh cadence, a portfolio view becomes a management tool rather than a monthly consolidation exercise.
Worth separating two categories people conflate: some hospitality AI is guest-facing — chat and messaging that help you talk to travelers. RM Copilot is operator-facing, working with your revenue team on the pricing decision itself.
Questions From the Revenue Meeting
The deep dives: Occupancy rate · ADR · RevPAR · TRevPAR · GOPPAR · RevPAR Index (RGI) · Turning numbers into decisions.