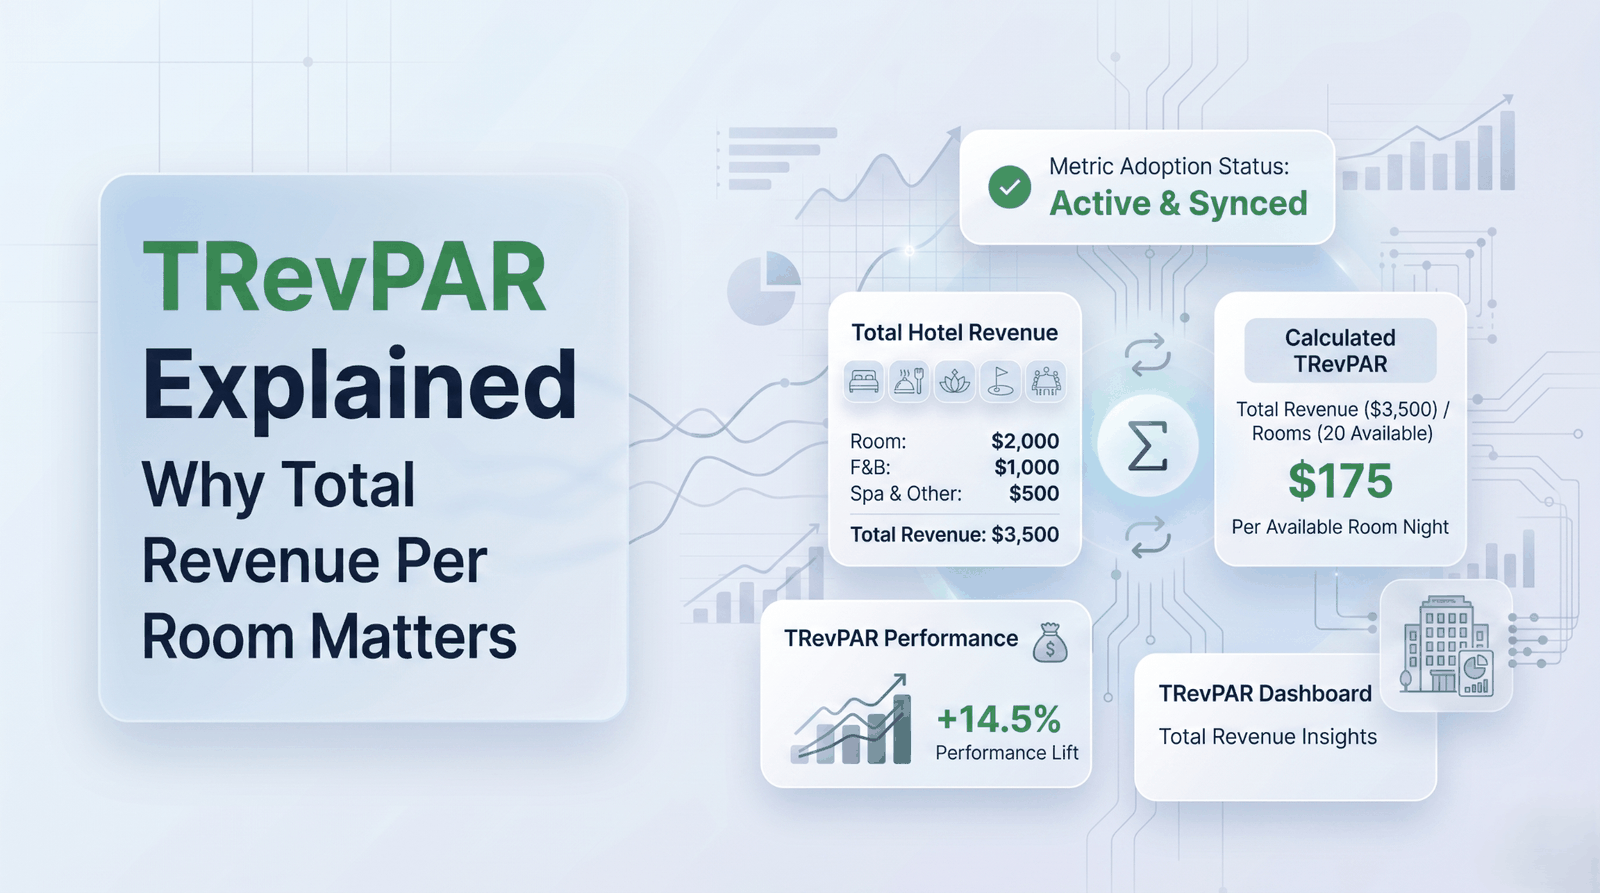
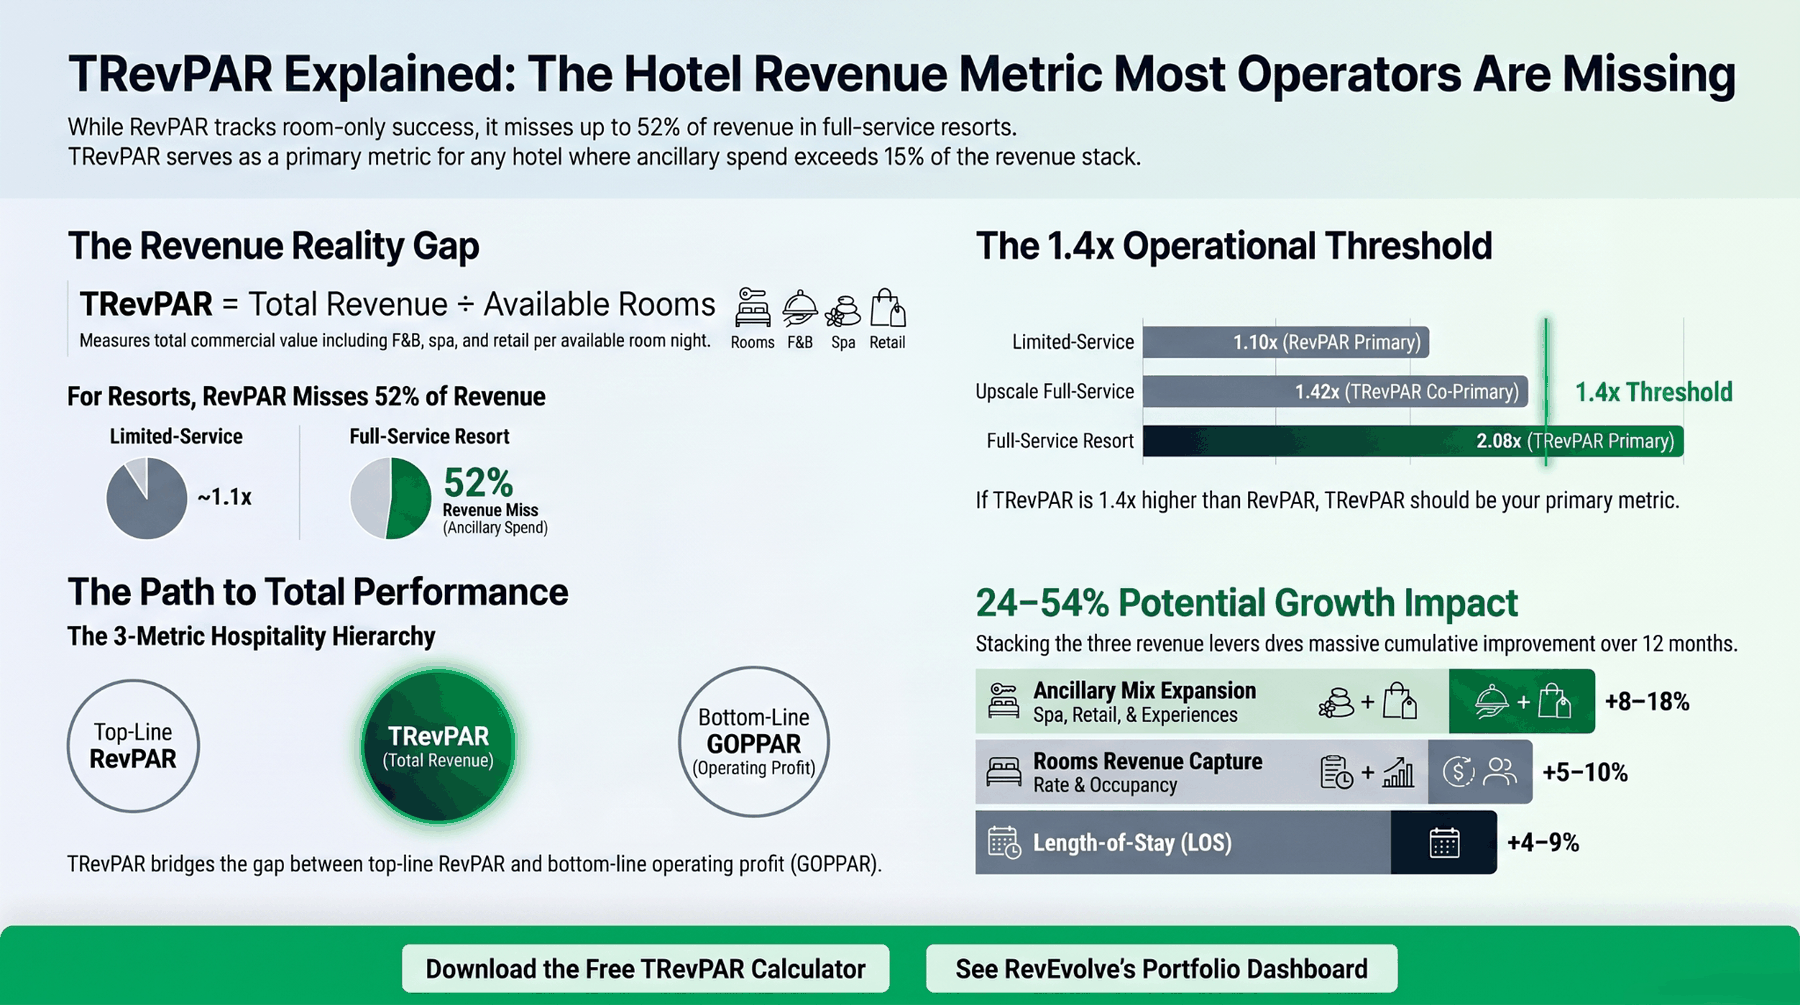
SNIPPET DEFINITION — TRevPAR (Total Revenue Per Available Room) is a hotel performance metric that measures total revenue — including F&B, spa, parking, retail, and every other ancillary stream — divided by the total number of available rooms in a given period. Unlike RevPAR, which captures only room revenue, TRevPAR reflects the full commercial value each available room generates for the property. Formula: TRevPAR = Total Revenue ÷ Available Rooms. It is the metric that matters most for full-service hotels, resorts, and any property where ancillary revenue is more than 15% of the total revenue stack.
Key takeaways
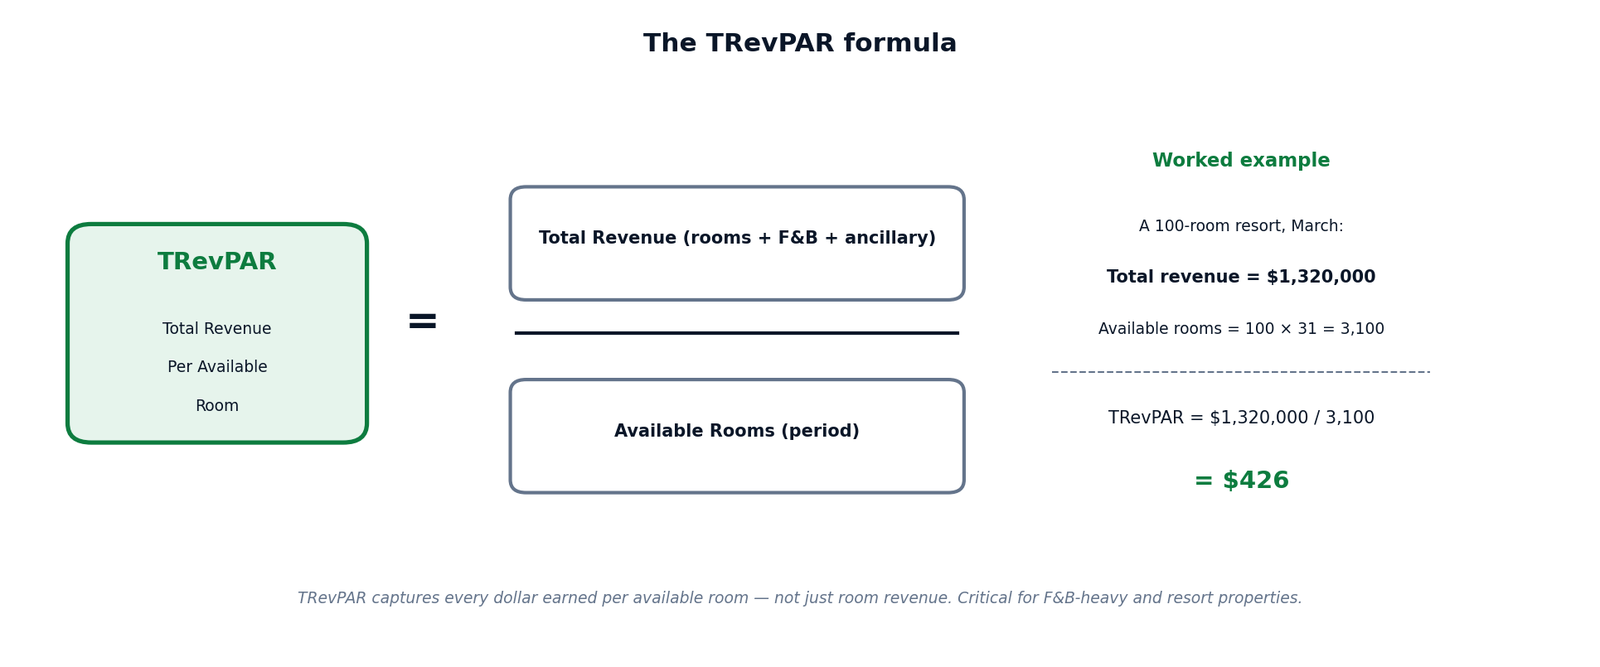
- TRevPAR = Total Revenue ÷ Available Rooms (per period). For a 100-room resort generating $1,320,000 in March, TRevPAR = $426.
- For limited-service hotels, TRevPAR is roughly 1.10× RevPAR — almost identical. For full-service resorts, TRevPAR runs 2.0×+ RevPAR — meaning RevPAR misses more than half the actual revenue per available room.
- The TRevPAR-to-RevPAR ratio is a structural property characteristic, not a strategic choice. The smaller your room-revenue slice, the more TRevPAR matters.
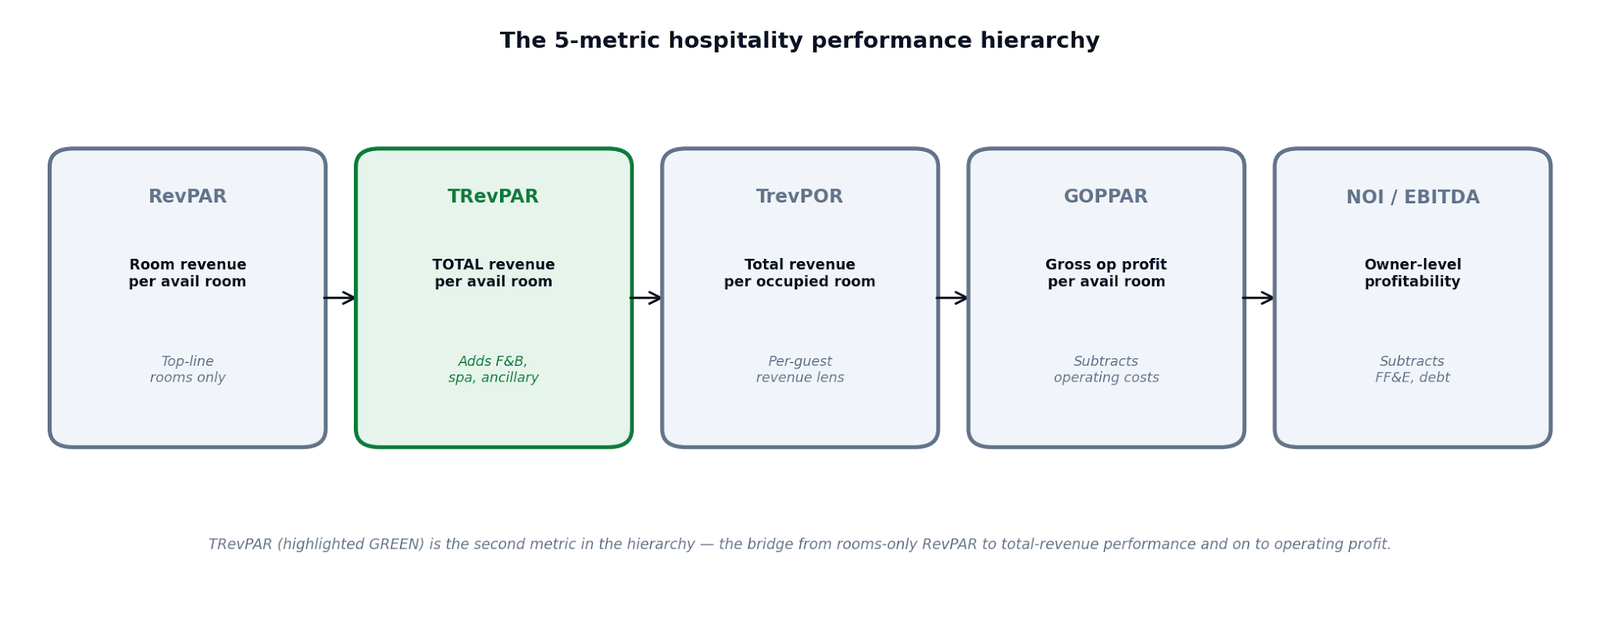
- TRevPAR sits between RevPAR and GOPPAR in the 5-metric hospitality performance hierarchy, bridging top-line rooms revenue and operating profitability.
- Properties that manage on RevPAR alone consistently underweight ancillary revenue investment (F&B, spa, retail) — which compounds into structural underperformance against full-service competitors.
- TRevPAR is improved by five levers: ancillary revenue mix expansion, rooms-revenue capture rate, length-of-stay extension, package/bundle pricing, and segment mix shift toward higher-spending guests.
→ Download the TRevPAR Calculator — a printable worksheet for calculating TRevPAR across your portfolio with worked examples for limited-service, full-service, and resort properties. Free at revevolve.ai/resources/trevpar-calculator/.
What Is TRevPAR?
TRevPAR — Total Revenue Per Available Room — is the per-room total-revenue metric that captures every dollar a hotel earns, divided by the rooms it has available to sell. It answers a question that RevPAR cannot: how much commercial value is each available room generating, including the revenue that doesn’t come from selling the room itself?
For a limited-service hotel where 90% of revenue comes from rooms, RevPAR and TRevPAR look almost identical — and managing on RevPAR alone is operationally fine. For a full-service resort where 50% or more of revenue comes from F&B, spa, parking, retail, golf, and other ancillary streams, RevPAR systematically underestimates the property’s revenue performance by 35–60%, and managing on it leads to structural underinvestment in the highest-margin parts of the business.
The metric was formalized as part of the Uniform System of Accounts for the Lodging Industry (USALI) and has been a standard owner-reporting metric in branded full-service and luxury portfolios for over a decade. What’s changing in 2026 is that independent boutique hotels and resort operators are now adopting TRevPAR as a co-primary metric alongside RevPAR, driven by margin compression that has made revenue-mix discipline financially essential.
The real-world definition that matters: TRevPAR is RevPAR’s missing context. RevPAR tells you how well you sold rooms. TRevPAR tells you how well you sold the entire stay. For any property where guests spend material money outside the room, the second question is the more important one.
The TRevPAR Formula
Where:
- Total Revenue = all revenue earned during the period from every revenue line on the property P&L: room revenue, F&B (broken out by outlet — restaurants, bars, banquet, in-room dining), spa/wellness, parking, retail, fees (resort fees, destination fees), and any other ancillary line.
- Available Rooms = total room nights physically available to sell during the period (rooms × days), regardless of whether they were sold or occupied. Same denominator as RevPAR.
Worked example
A 100-room full-service resort, March 2026:
| Revenue line | Amount |
|---|---|
| Room revenue | $920,000 |
| F&B revenue (restaurants + banquets) | $260,000 |
| Spa revenue | $85,000 |
| Resort fee revenue | $35,000 |
| Other ancillary (parking, retail, activities) | $20,000 |
| Total revenue | $1,320,000 |
| Available rooms (100 × 31) | 3,100 |
| TRevPAR | $426 |
| (For reference — RevPAR) | $297 |
For the same hotel: TRevPAR is $426 vs RevPAR of $297. The $129 gap — a 43% uplift — is the per-available-room contribution from F&B, spa, fees, and ancillary streams. For this property, managing on RevPAR alone is leaving 30% of the revenue picture unmeasured.
TRevPAR vs RevPAR — The Critical Difference
If you take one thing from this article, take this: two hotels with identical RevPAR can have very different TRevPAR. The difference is not random — it’s a structural feature of the property’s revenue stack.
A worked comparison
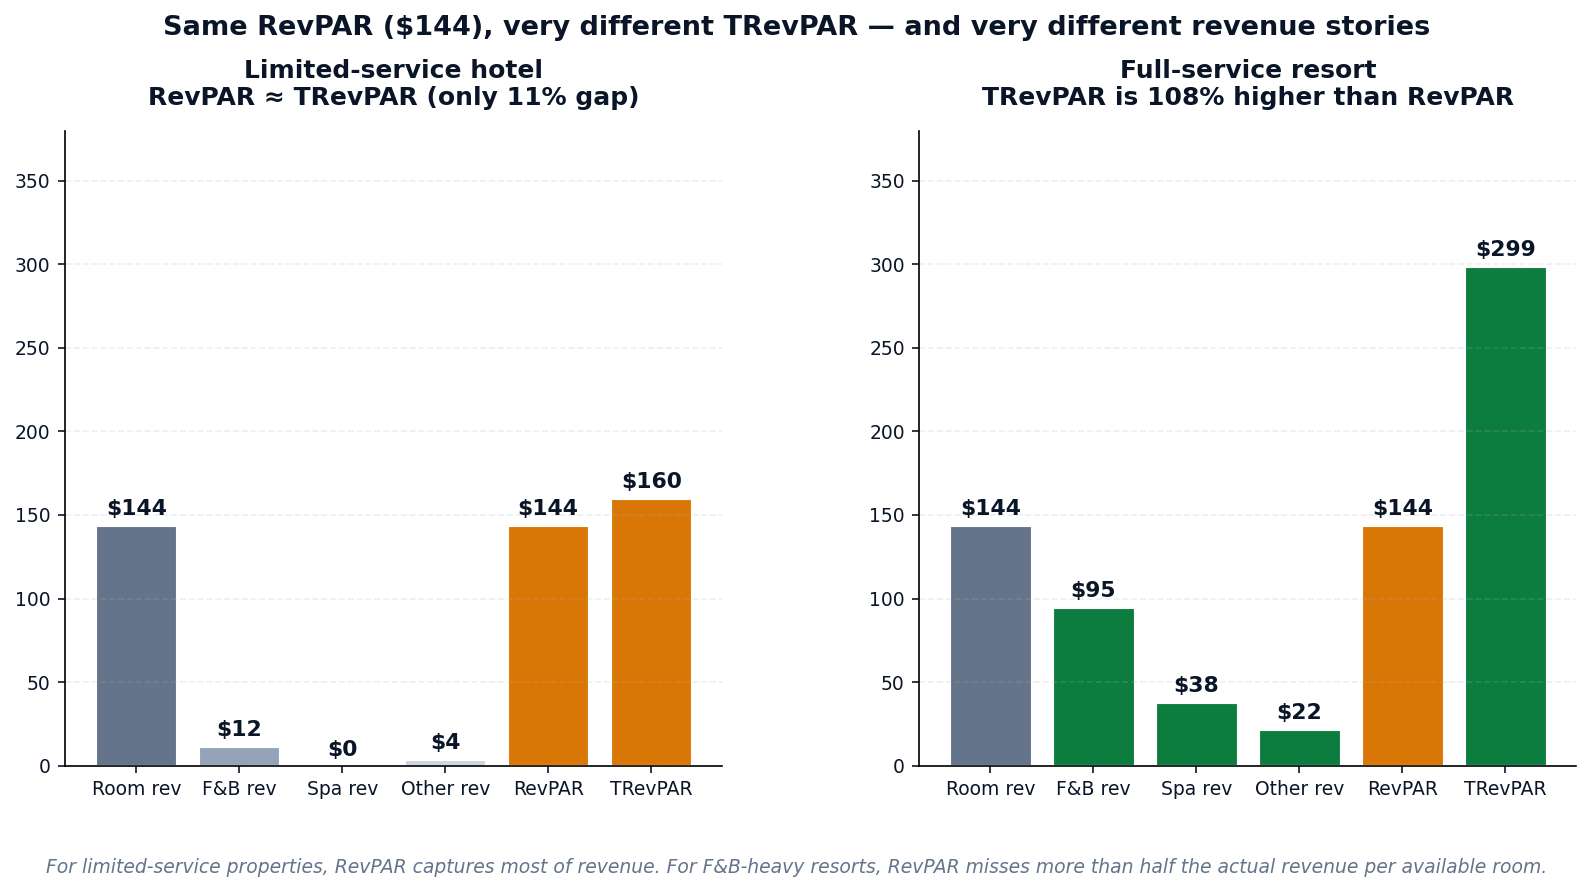
Limited-service hotel — same $144 RevPAR:
- Room rev: $144 · F&B: $12 · Spa: $0 · Other: $4
- TRevPAR: $160 (just 11% above RevPAR)
- Operating implication: RevPAR captures 90% of revenue. Managing on RevPAR alone is fine.
Full-service resort — same $144 RevPAR:
- Room rev: $144 · F&B: $95 · Spa: $38 · Other: $22
- TRevPAR: $299 (108% above RevPAR)
- Operating implication: RevPAR captures only 48% of revenue. Managing on RevPAR alone misses most of the revenue picture.
Same RevPAR. The full-service resort is generating 87% more revenue per available room than the limited-service hotel. A revenue manager comparing only RevPAR would see two hotels performing identically. A revenue manager looking at TRevPAR would see two completely different commercial machines.
When RevPAR misleads
Three scenarios where RevPAR-only management costs hotels real money:
- F&B-heavy properties using RevPAR as the primary metric. When the revenue manager optimizes for room rate alone, F&B capture rates drift downward — and the property’s actual revenue performance slips without showing up in headline metrics.
- Comparing properties of different service tiers on RevPAR. Benchmarking a full-service resort against limited-service properties (or vice versa) on RevPAR produces meaningless comparisons that mislead asset managers and lenders.
- Justifying ancillary investment. Capex investment in spa expansion, F&B renovation, or retail repositioning can’t be justified using RevPAR — the metric doesn’t move when these areas improve. TRevPAR captures the lift.
The Revenue Stack — Why TRevPAR Matters Depends on Your Property
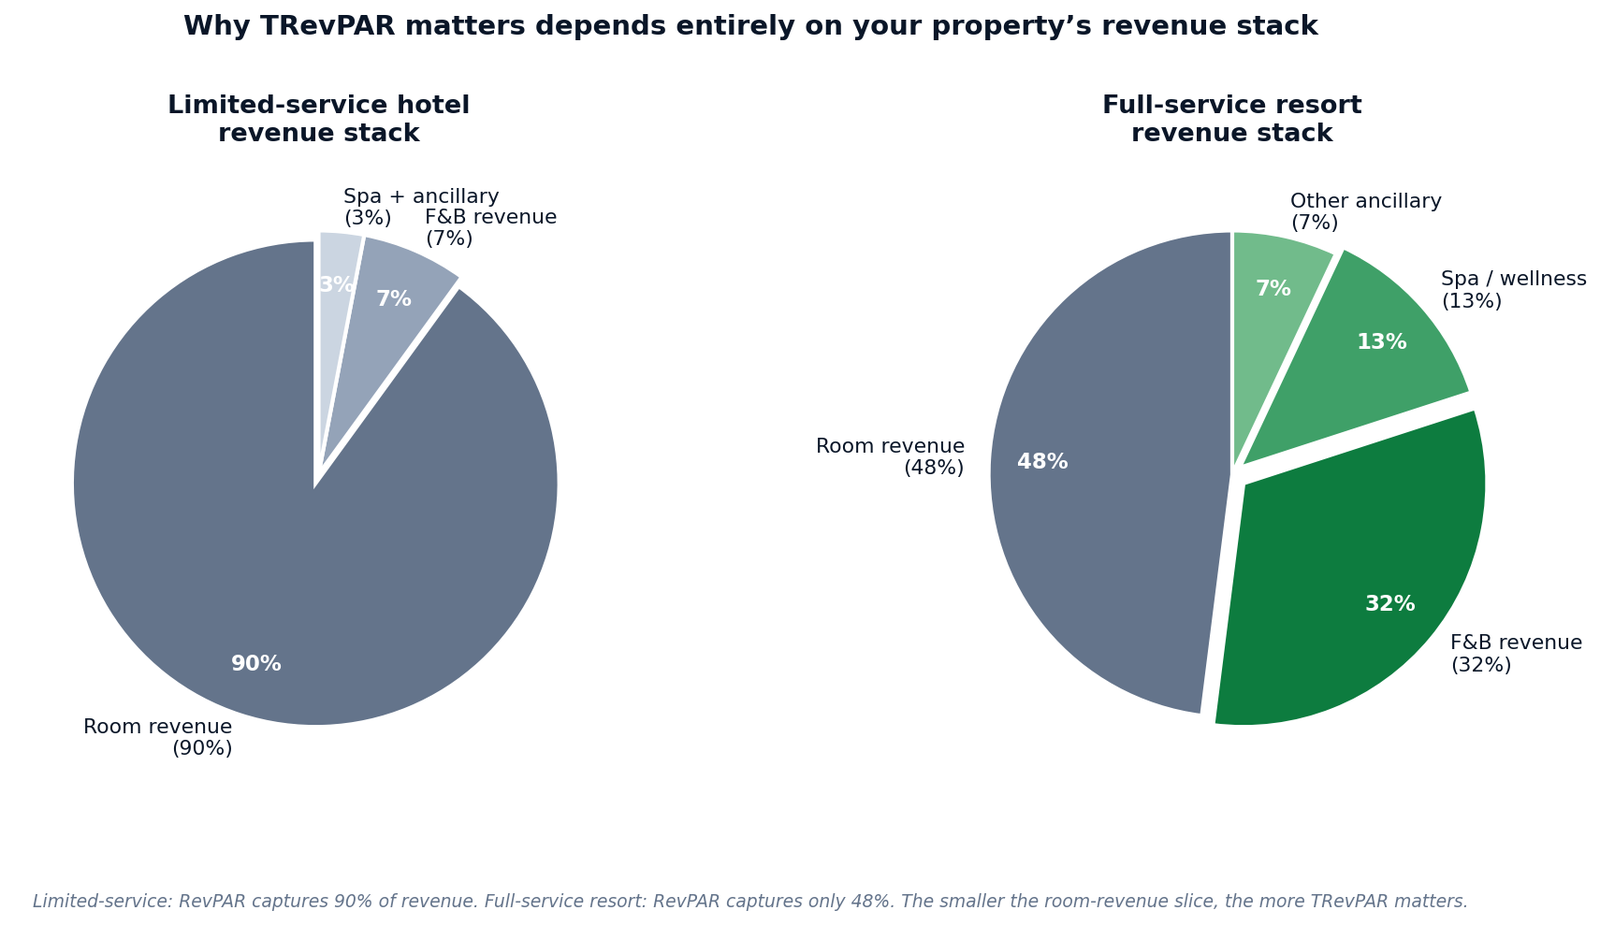
The TRevPAR-to-RevPAR ratio isn’t strategy. It’s structure. The composition of your revenue stack determines how much TRevPAR matters for your property — and operators who manage as if their stack is something it isn’t make systematic mistakes.
The two extremes
- Limited-service hotel: 90% room revenue · 7% F&B · 3% other ancillary. RevPAR captures 90% of revenue. TRevPAR is barely additive. Most decisions can be made on RevPAR alone.
- Full-service resort: 48% room revenue · 32% F&B · 13% spa/wellness · 7% other. RevPAR captures less than half of revenue. Decisions made on RevPAR alone systematically underweight 52% of the revenue pie.
Where most properties sit
Most properties fall between these two extremes:
- Mid-scale hotels (limited F&B): typically 80–88% room revenue. RevPAR remains primary metric; TRevPAR is a check.
- Upscale full-service: typically 60–72% room revenue. TRevPAR becomes co-primary with RevPAR.
- Boutique with strong F&B: typically 55–65% room revenue. TRevPAR is the strategic metric; RevPAR is the operational subset.
- Luxury / ultra-luxury: typically 50–60% room revenue. TRevPAR is the primary metric for owner reporting.
- Full-service resort: typically 40–55% room revenue. TRevPAR is the primary metric; RevPAR alone is materially incomplete.
The operator implication: Your revenue stack determines which metric should anchor your operating discipline. Run the numbers on your last full year — what percent of revenue came from rooms? If the answer is 70% or below, TRevPAR isn’t optional; it’s primary.
TRevPAR-to-RevPAR Ratio — How Much Bigger Is TRevPAR?
The TRevPAR-to-RevPAR ratio is the simplest diagnostic for whether your property should be running on RevPAR or TRevPAR.
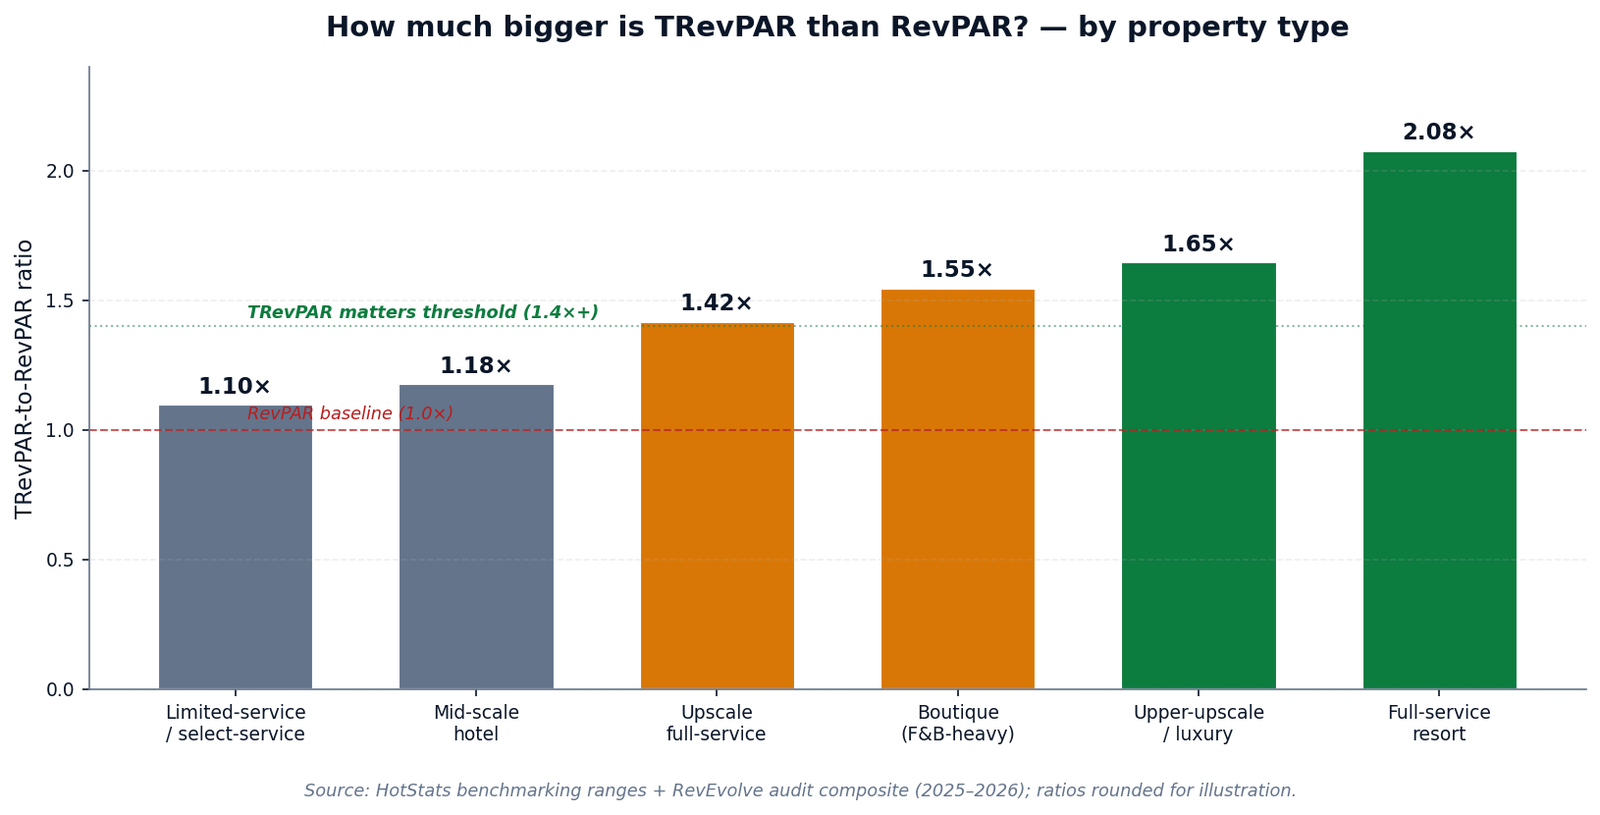
The 1.4× threshold
| Property type | Typical TRevPAR-to-RevPAR ratio | Primary metric |
|---|---|---|
| Limited-service / select-service | 1.10× | RevPAR |
| Mid-scale hotel | 1.18× | RevPAR (TRevPAR as check) |
| Upscale full-service | 1.42× | TRevPAR (co-primary) |
| Boutique (F&B-heavy) | 1.55× | TRevPAR |
| Upper-upscale / luxury | 1.65× | TRevPAR |
| Full-service resort | 2.08× | TRevPAR |
How to compute your own ratio
Pull your last 12 months of total revenue (every line, not just rooms). Pull your last 12 months of room revenue. Divide both by the same available-room denominator. The ratio between them is your TRevPAR-to-RevPAR ratio.
- If your ratio is below 1.2×, RevPAR-only management is operationally adequate.
- If your ratio is between 1.2× and 1.4×, you should report on both, and consider which best supports your owner conversations.
- If your ratio is 1.4× or higher, you should be running TRevPAR as a primary metric — and any RMS or BI dashboard that doesn’t surface TRevPAR is missing something material.
The 5-Metric Hospitality Performance Hierarchy (Where TRevPAR Sits)
TRevPAR doesn’t replace any other metric. It sits alongside them in a 5-metric hierarchy that progresses from top-line rooms revenue all the way down to owner-level profitability.
| Metric | Formula | What it captures | Who uses it |
|---|---|---|---|
| RevPAR | Room revenue ÷ Available rooms | Top-line room revenue only | Revenue managers, GMs |
| TRevPAR | Total revenue ÷ Available rooms | Total per-available-room revenue including F&B, spa, ancillary | F&B-heavy operators, resort RMs, asset managers |
| TrevPOR | Total revenue ÷ Occupied rooms | Per-guest total revenue | Resort RMs, F&B-heavy hotels |
| GOPPAR | Gross Operating Profit ÷ Available rooms | Operating profit per room | Asset managers, owners, lenders |
| NOI / EBITDA | (GOP − fixed charges − FF&E) | Owner-level profitability | Owners, investors, analysts |
TRevPAR vs TrevPOR — the per-available vs per-occupied distinction
These two metrics are frequently confused. The difference is the denominator:
- TRevPAR uses available rooms (capacity-normalized). It compares properties of different sizes consistently and rewards filling more rooms.
- TrevPOR uses occupied rooms (guest-normalized). It measures the revenue intensity per guest stay, regardless of how many rooms were sold.
For a property running 60% occupancy, TrevPOR will be ~67% higher than TRevPAR (1 ÷ 0.60). The two metrics tell different stories: TRevPAR rewards both rate AND occupancy AND ancillary spend; TrevPOR rewards only ancillary spend per guest. Use both — they’re complementary, not redundant.
How to Improve TRevPAR — The 5 Levers
TRevPAR improvement is a function of revenue mix and revenue capture. Pulling any of these five levers raises it:
Lever 1 — Ancillary revenue mix expansion
Adding new revenue streams (spa, retail, experiences, parking, premium F&B) directly grows TRevPAR without affecting RevPAR. For full-service properties, this is the single highest-leverage TRevPAR move.
Expected lift: 8–18% TRevPAR over 12 months for properties with material ancillary expansion potential.
Lever 2 — Rooms-revenue capture rate (the RevPAR connection)
Improving RevPAR (better rate optimization, segment mix, occupancy) flows directly through to TRevPAR — because rooms revenue is still the largest single line in the stack for most properties.
Expected lift: 5–10% TRevPAR over 12 months for properties with rate-optimization room.
Lever 3 — Length-of-stay extension
Longer stays compound ancillary spend. A 3-night stay generates not 3× the F&B revenue of a 1-night stay but typically 2.4× — because guests order more breakfast, more dinner, more spa, more retail per incremental night. Engineering longer average stays through pricing rules and length-of-stay restrictions raises TRevPAR meaningfully.
Expected lift: 4–9% TRevPAR over 12 months.
Lever 4 — Package and bundle pricing
Bundling rooms with F&B credits, spa credits, or experience credits at slight discounts to the unbundled total drives both higher capture and higher per-stay total spend. This is the operational tool that converts segment-level marketing into TRevPAR uplift.
Expected lift: 3–7% TRevPAR over 12 months.
Lever 5 — Segment mix shift toward higher-spending guests
Different guest segments spend differently outside the room. Group business typically spends more on F&B than transient corporate. Leisure guests spend more on spa and retail than business travelers. Shifting segment mix toward higher-ancillary-spending segments raises TRevPAR without changing room rate or occupancy.
Expected lift: 4–10% TRevPAR over 12 months at full-service properties.
Common TRevPAR Mistakes Hotels Make
Five errors RevEvolve audit teams see consistently when reviewing operator TRevPAR reporting:
- Using TRevPAR without RevPAR alongside it. TRevPAR can rise while RevPAR falls — for example, if F&B revenue grows materially while room rate slips. Hide this from yourself and you’ll over-discount room rate. Always report RevPAR and TRevPAR together.
- Including non-recurring or non-revenue items. Insurance recoveries, asset sales, partnership fees, and one-time items don’t belong in TRevPAR. Keep the calculation to operating revenue lines only.
- Comparing TRevPAR across properties of different service tiers. A limited-service TRevPAR of $160 vs a full-service resort TRevPAR of $426 doesn’t tell you anything useful. Compare TRevPAR within service tier, not across.
- Ignoring seasonality in TRevPAR comparisons. Ancillary revenue is more seasonal than room revenue at most properties — spa picks up in winter at ski resorts, F&B picks up in event-heavy quarters. Compare like-for-like periods (March 2026 vs March 2025), not month-on-month.
- Failing to report TRevPAR alongside GOPPAR. TRevPAR shows revenue performance; GOPPAR shows whether that revenue is converting to profit. Reporting TRevPAR alone obscures whether the revenue mix is profitable. Modern portfolio dashboards report all three — RevPAR, TRevPAR, GOPPAR — in a single owner-facing view.
TRevPAR Benchmarks by Property Type (2025–2026)
TRevPAR varies materially by property type, market, and seasonality. The table below is directional — use it to triangulate where your property sits:
| Property type | Typical TRevPAR range (annual avg, USD) |
|---|---|
| Limited-service / select-service | $50 – $110 |
| Mid-scale / upper mid-scale | $85 – $160 |
| Upscale full-service | $160 – $290 |
| Boutique (F&B-heavy) | $180 – $340 |
| Upper-upscale / luxury | $290 – $620 |
| Full-service resort | $300 – $850+ |
The single most useful comparable for any property is its own portfolio peers — properties of the same class, market, and brand operating model. Industry-average benchmarks are starting points; portfolio-specific benchmarks are operating standards.
Conclusion — RevPAR Tells One Story; TRevPAR Tells the Whole One
For limited-service hotels with 90% room-revenue mix, RevPAR is the right primary metric and TRevPAR is a footnote. For full-service resorts, F&B-heavy boutiques, luxury hotels, and most upscale full-service properties, RevPAR captures less than half of the actual revenue picture — and managing on it leads to systematic underinvestment in the parts of the property that drive the most profit.
The decision rule is simple: pull your TRevPAR-to-RevPAR ratio. Below 1.2×, run on RevPAR. Between 1.2× and 1.4×, run on both. Above 1.4× — and especially above 1.6× — TRevPAR is your primary metric, and RevPAR is the room-revenue subset of it.
The hotels that get this right invest deliberately in F&B, spa, retail, and ancillary streams that compound into TRevPAR uplift, and report on both RevPAR and TRevPAR in monthly owner conversations. The hotels that get this wrong keep optimizing room rate while their full-service competitors quietly grow TRevPAR at 2–3× the pace — and only notice when their next refinancing comes up and the lender wants a TRevPAR trend report.
Stop benchmarking full-service properties on RevPAR alone in 2026.
- → See RevEvolve’s Portfolio Dashboard — track TRevPAR, RevPAR, and GOPPAR in a single operator-facing view with attribution to which lever moved. 15-min walkthrough.
- → Download the TRevPAR Calculator (free) — printable worksheet for calculating TRevPAR across your portfolio.