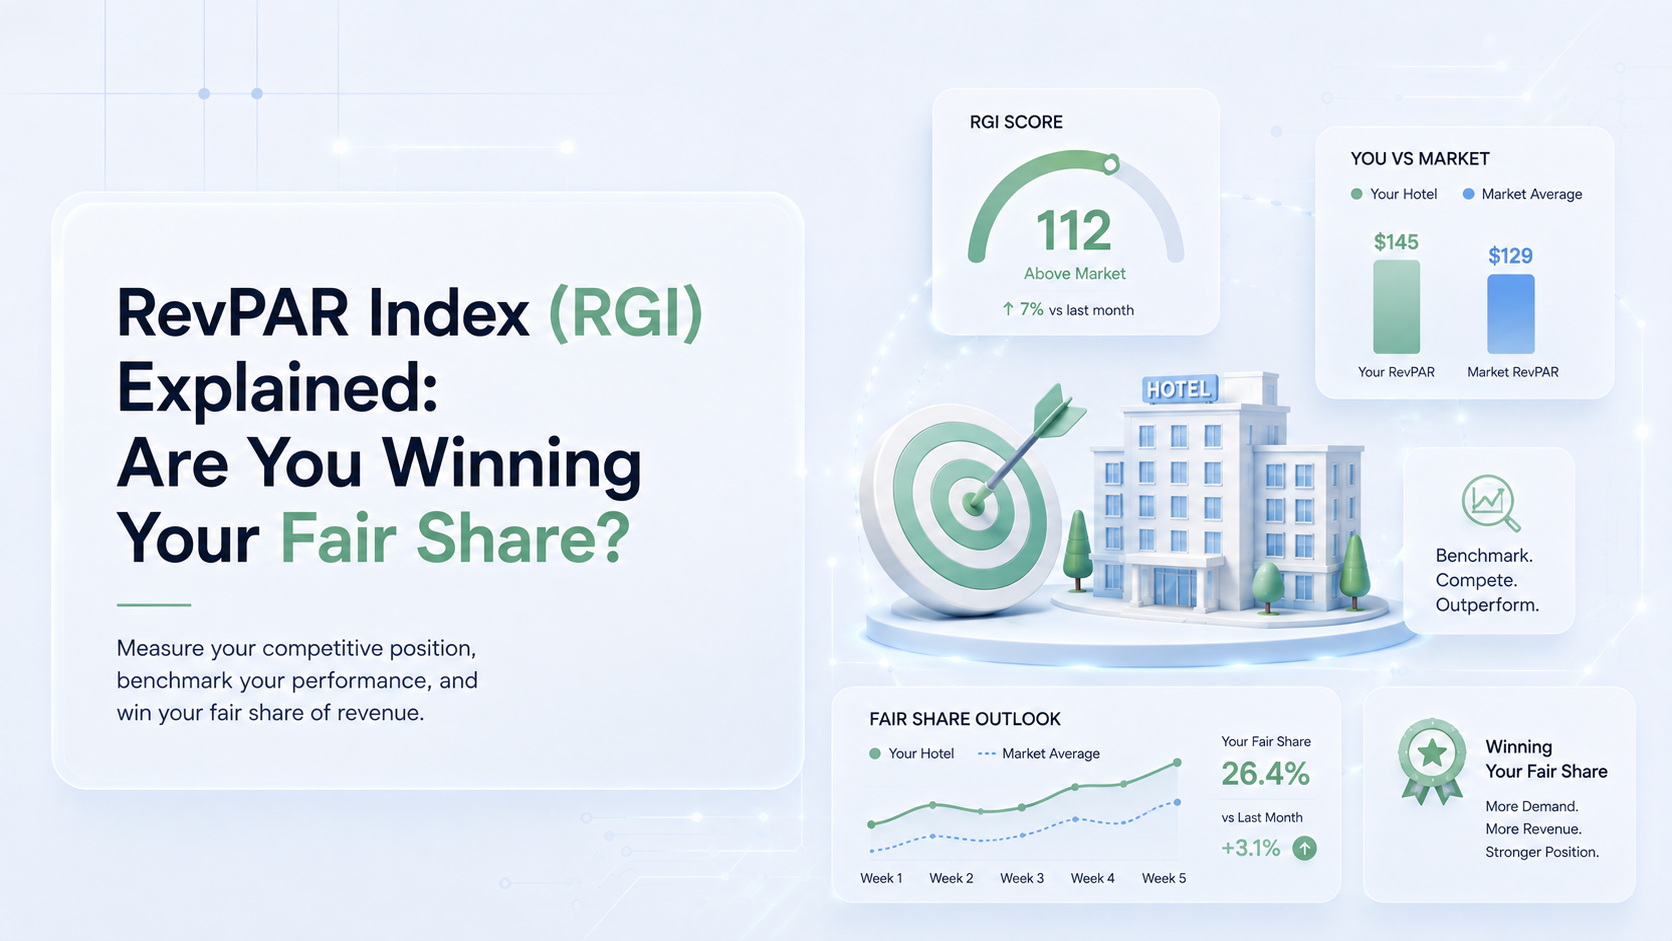
QUICK ANSWER — RevPAR Index — also called RGI, or Revenue Generation Index — measures your RevPAR against your competitive set’s. The formula is RGI = (Your RevPAR ÷ Comp Set RevPAR) × 100. An RGI of 100 means you captured exactly your fair share of market revenue; 110 means you captured 10% more than your room count entitled you to. It is the index owners, asset managers, and lenders watch most closely.
Your RevPAR fell $14 this quarter. Is that a bad quarter or a good one? On its own the number cannot tell you — if your market fell $20, you just gained share. RGI is the metric that settles it.
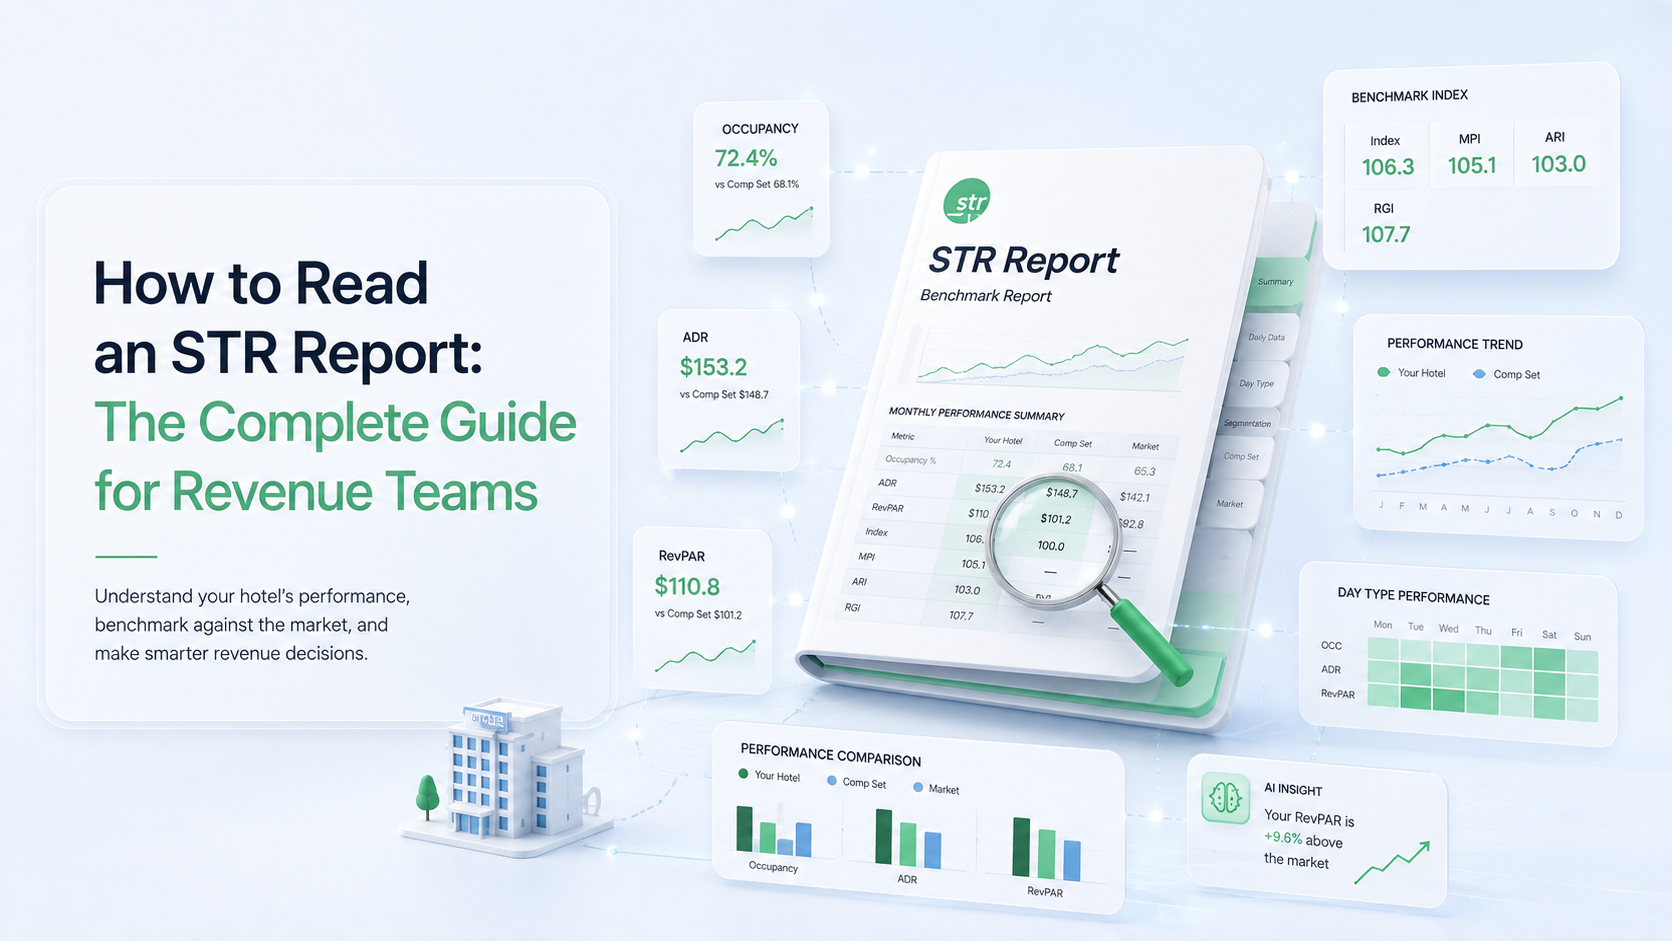
Your comp set is who you measure against — we covered how to build one separately. This guide is about the number that comes out of it: RGI. If you want to read the full benchmarking report end to end, that is a different job; here we go deep on one index and what to do about it.
Our RGI has been under 100 for three quarters and the asset manager wants a plan. I can see the number. What I can’t see is which lever moved it.
Key takeaways
- RGI = (Your RevPAR ÷ Comp Set RevPAR) × 100. RevPAR Index and RGI are the same metric under two names.
- 100 is fair share, not average — the share of market revenue your room count entitles you to.
- RGI on its own diagnoses nothing. Split it into MPI and ARI to find out whether rate or occupancy moved it.
- RGI can rise while your RevPAR falls. In a declining market, losing less than your comp set is a share gain.
- Across a portfolio, RGI variance matters more than the average. EMA Hospitality cut variance ~50% across 47 hotels.
What Is RevPAR Index (RGI)?
The naming causes needless confusion, so to be clear: RevPAR Index, RPI, and RGI (Revenue Generation Index) are three names for the same calculation. Different data providers and brands favour different labels. The math does not change.
What makes RGI different from RevPAR itself is that RevPAR is an absolute number and RGI is a relative one. RevPAR tells you what you earned. RGI tells you whether that was any good given what everyone around you earned. In a strong market a rising RevPAR can still mean you are falling behind; in a weak one a falling RevPAR can mean you are winning.
Why RGI Carries More Weight Than Any Other Index
Among revenue managers, RGI is one metric of several. Among the people who own and finance hotels, it is close to the metric.
The reason is that RGI strips out the market. Absolute RevPAR moves with the economy, the events calendar, and the season — none of which an operator controls. RGI isolates the part that is actually attributable to how the property was run. That makes it the fairest available basis for judging performance, which is exactly why it ends up in contracts.
Ownership groups commonly write explicit RGI targets into management agreements. Sustained underperformance against a comp set can, in some contracts, trigger operator termination clauses. Lenders increasingly look at RGI alongside absolute RevPAR when assessing an asset. If you manage hotels for other people, RGI is the number your job is measured on.
What “Fair Share” Actually Means
Fair share is the concept that makes the index intelligible, and it is the part most explanations skip past.
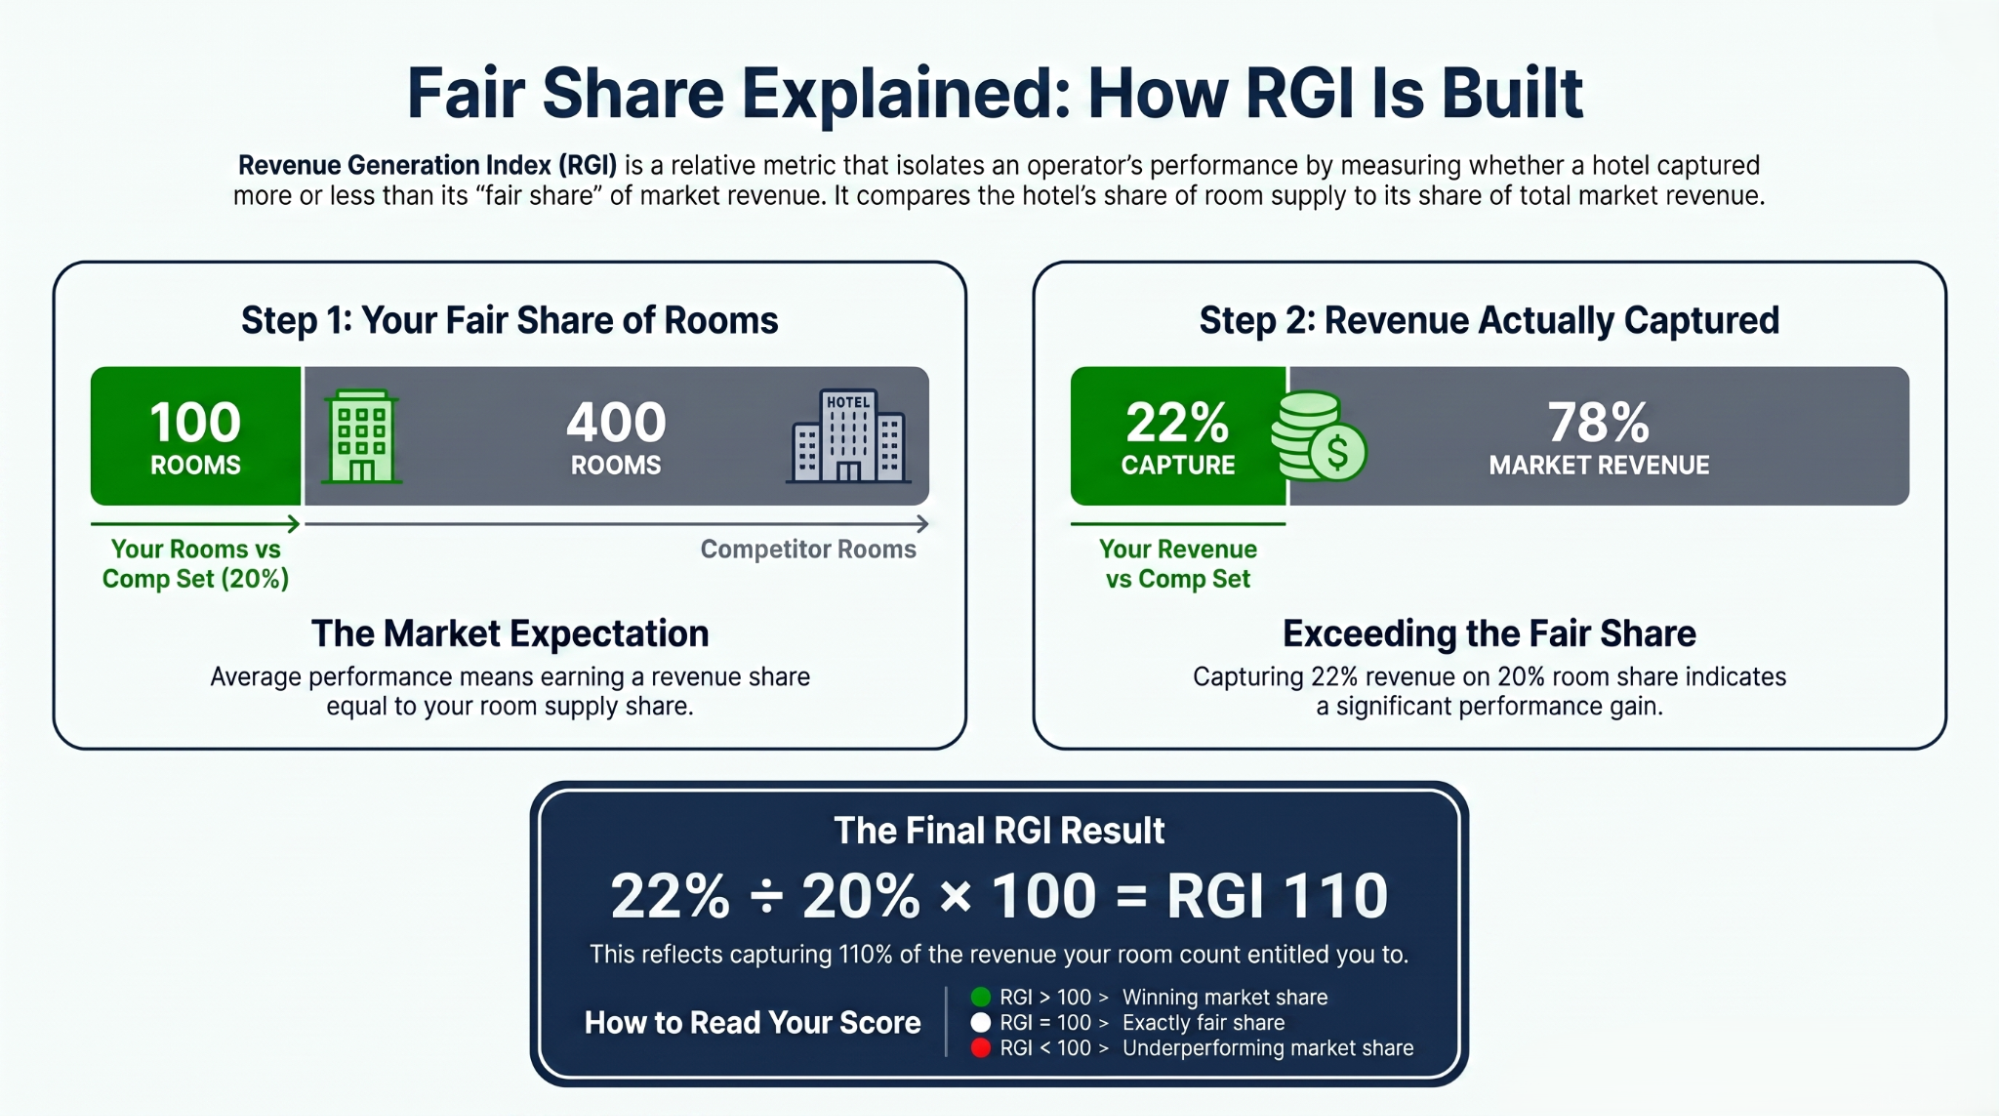
Your fair share is not “the average.” It is the proportion of the comp set’s business that your room count entitles you to. If you operate 100 rooms inside a comp set totalling 500 rooms, your fair share of the market’s revenue is 20%. Capture exactly 20% and your RGI is 100. Capture 22% and it is 110.
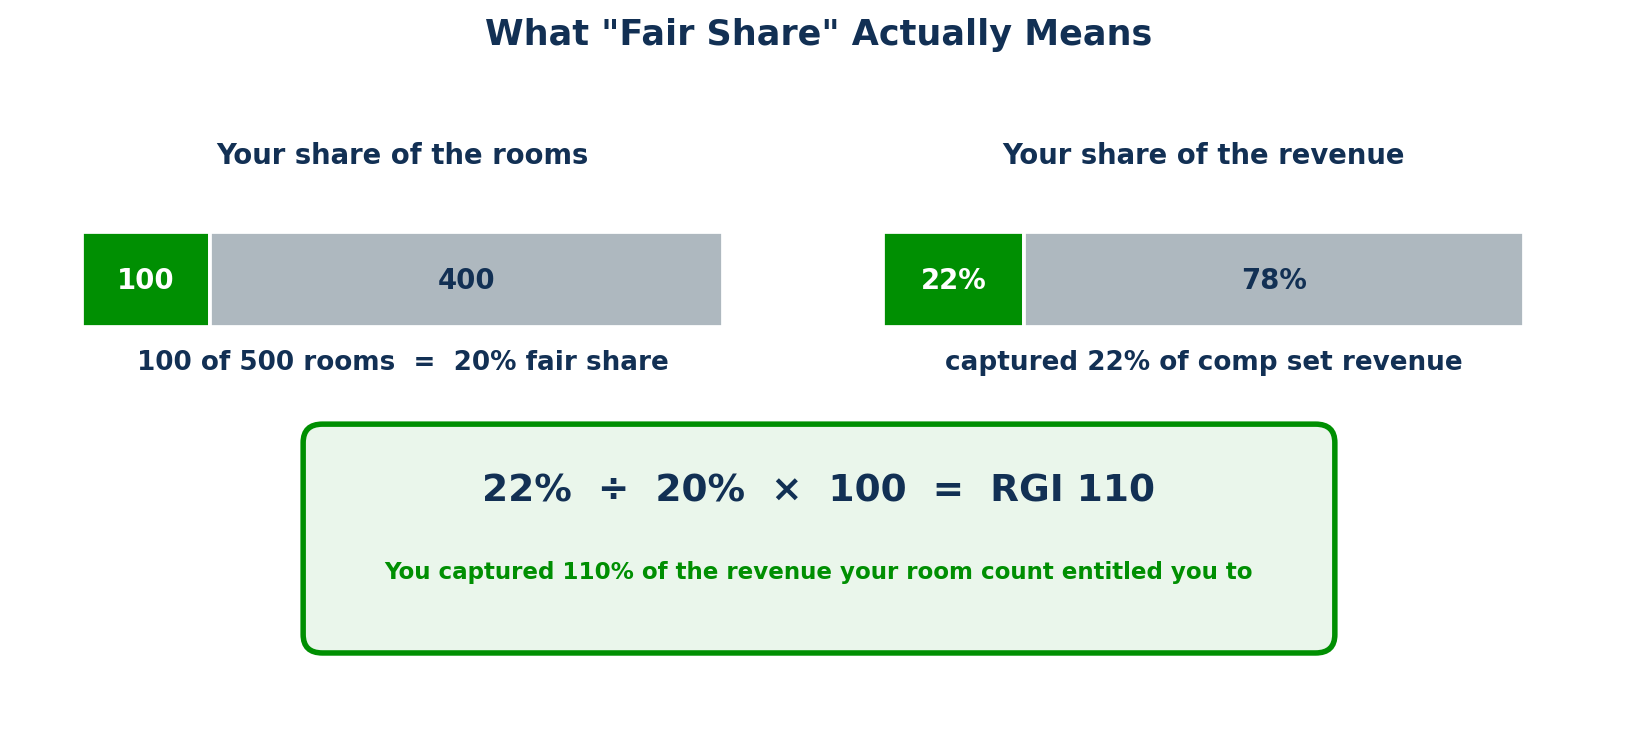
This is why RGI is comparable across properties of wildly different sizes. A 60-room boutique and a 400-room convention hotel can both post an RGI of 104, and it means the same thing for both — each earned 4% more than its inventory entitled it to.
The formula
RGI = (Your RevPAR ÷ Comp Set RevPAR) × 100.
Worked example: your RevPAR for the period is $155. Your comp set’s aggregate RevPAR is $140. RGI = 155 ÷ 140 × 100 = 110.7. You generated 10.7% more revenue per available room than the set. The revenue gap is $15 per available room per night — across 100 rooms and a 90-day quarter, roughly $135,000 of outperformance.
RGI Alone Diagnoses Nothing — Split It Into MPI and ARI
An RGI of 94 tells you there is a problem. It does not tell you what kind, and the two possible causes call for opposite responses. Cut rate to fix a rate problem and you make it worse.
Two companion indices break it apart. MPI (Market Penetration Index) compares your occupancy to the set. ARI (Average Rate Index) compares your ADR. Both use the same structure — yours divided by theirs, times 100 — and RGI is approximately the two multiplied together and divided by 100.
| Index | Compares | Formula | Tells you |
|---|---|---|---|
| MPI | Occupancy | (Your Occ ÷ Comp Set Occ) × 100 | Whether you are filling your share of rooms |
| ARI | ADR | (Your ADR ÷ Comp Set ADR) × 100 | Whether you are holding your share of rate |
| RGI | RevPAR | (Your RevPAR ÷ Comp Set RevPAR) × 100 | The net result of the two |
Plotted against each other, MPI and ARI produce four quadrants — and each one has a different correct response.
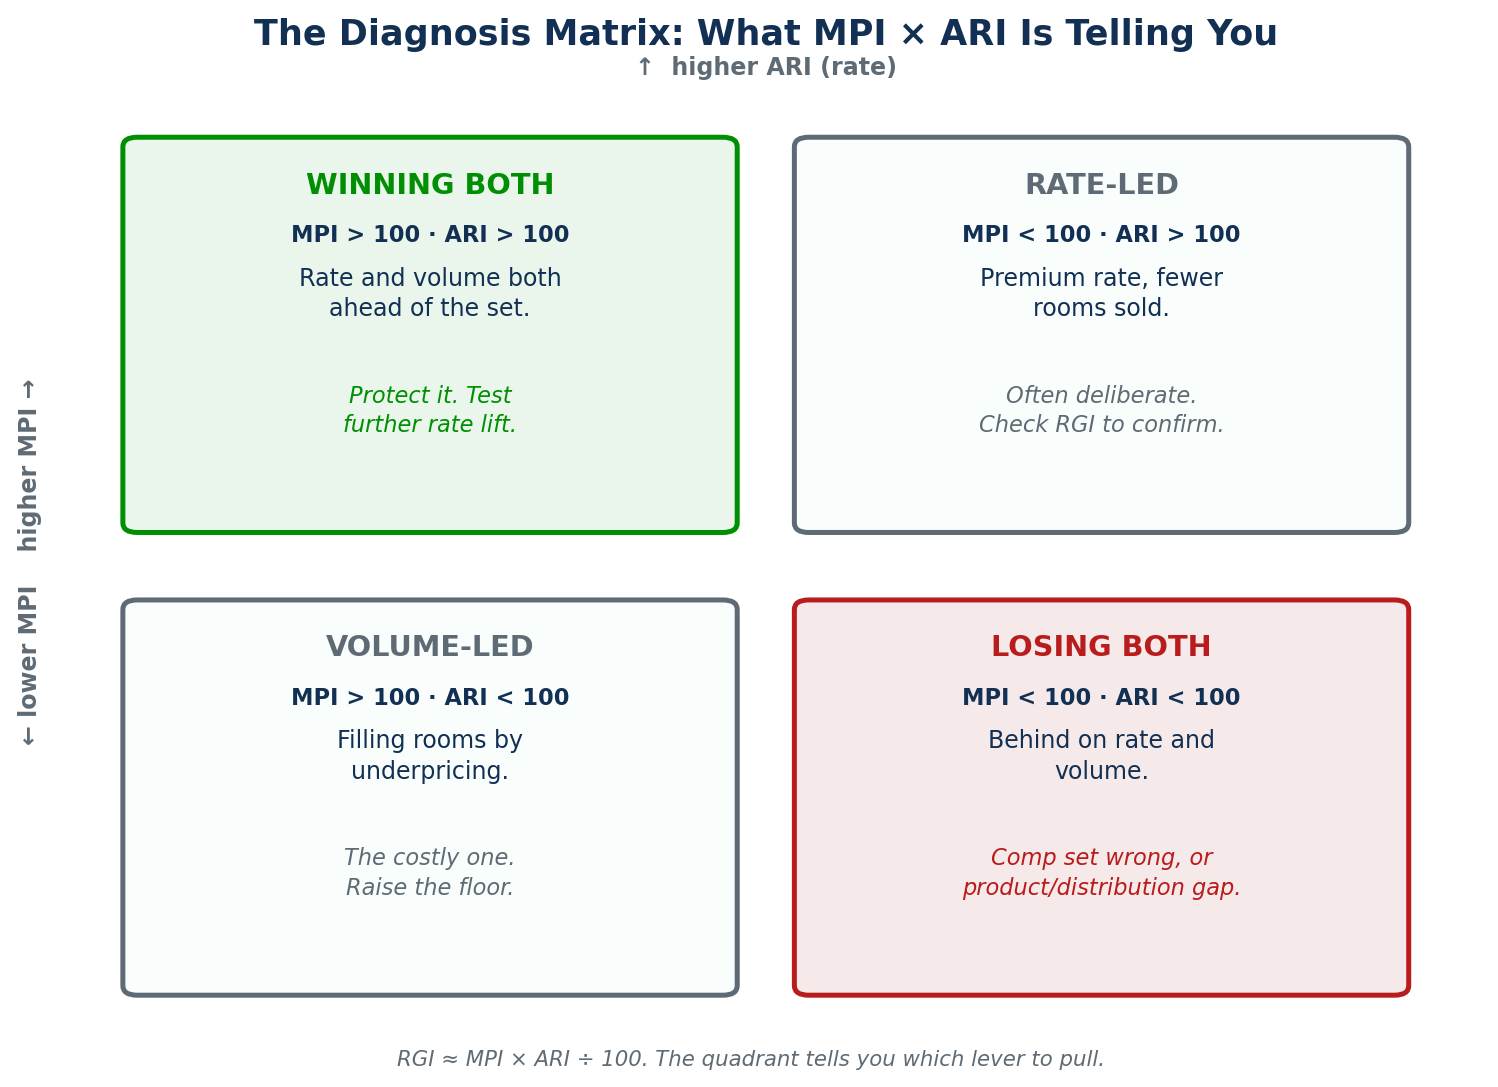
Winning both (MPI > 100, ARI > 100)
Rare and worth protecting. You are filling more rooms than your share at a higher rate than the set. The action is not complacency — it is testing whether the rate can go further, because a comp set you beat on both counts is usually one you are underpriced against.
Rate-led (MPI < 100, ARI > 100)
Premium positioning: fewer rooms, higher rate. Frequently deliberate and frequently correct. Check RGI to confirm the trade is working — if RGI is above 100, the strategy is paying. If RGI is below 100, you have priced past your demand.
Volume-led (MPI > 100, ARI < 100)
The expensive quadrant, and the most common. You are winning occupancy by underpricing. It looks like success on the occupancy report and drains RGI. The fix is raising the floor on the dates where you are filling earliest, not an across-the-board increase.
Losing both (MPI < 100, ARI < 100)
Behind on rate and volume simultaneously. Before treating this as a pricing failure, check the comp set. If you are benchmarked against hotels in a different class, every index will read low for reasons no pricing decision can fix. If the comp set is right, this is a product, distribution, or demand-generation problem rather than a revenue management one.
When RGI Rises and RevPAR Falls
The most counterintuitive thing about RGI is that it moves independently of your own revenue, because it is measuring a gap rather than a level.
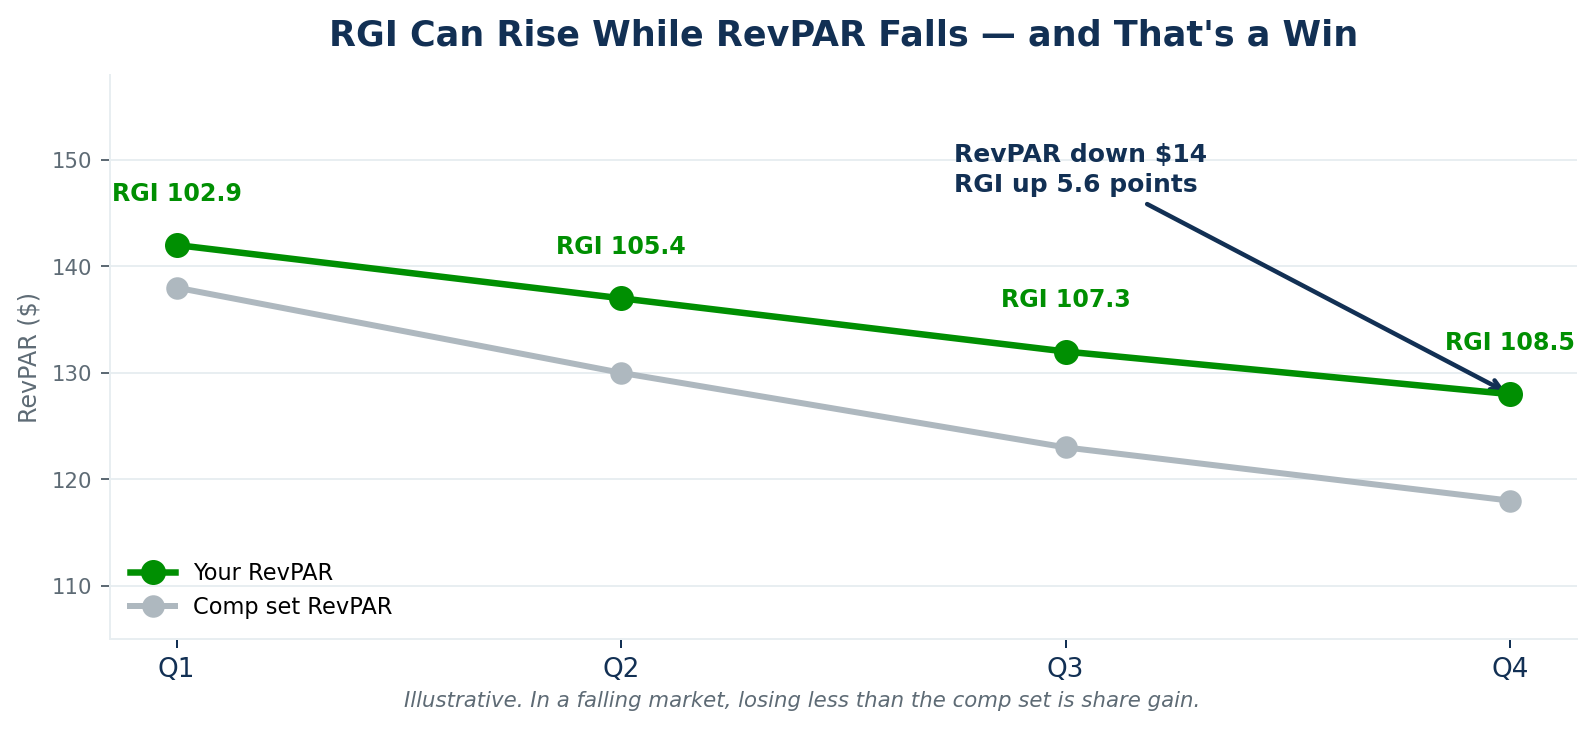
Here a property’s RevPAR slides from $142 to $128 across four quarters — a $14 decline that reads as a bad year on its own. Over the same period the comp set falls from $138 to $118. The RGI climbs from 102.9 to 108.5. The property lost revenue and gained share, which in a contracting market is exactly what good management looks like.
The reverse also holds, and it is the more dangerous one. A rising RevPAR in a rapidly rising market can conceal a falling RGI — you made more money and still lost ground. Absolute numbers feel like progress; only the index tells you whether you kept up.
Portfolio RGI: Why Variance Beats the Average
For a single property, RGI is a score. Across a portfolio, the average RGI is close to useless — and the spread is where the money is.
A management company reporting a portfolio average RGI of 100 might have every hotel sitting between 97 and 103, or it might have a dozen at 118 and a dozen at 82. Identical average, entirely different businesses. The first is a consistent operation. The second has systematic underperformance hiding behind its own stars.
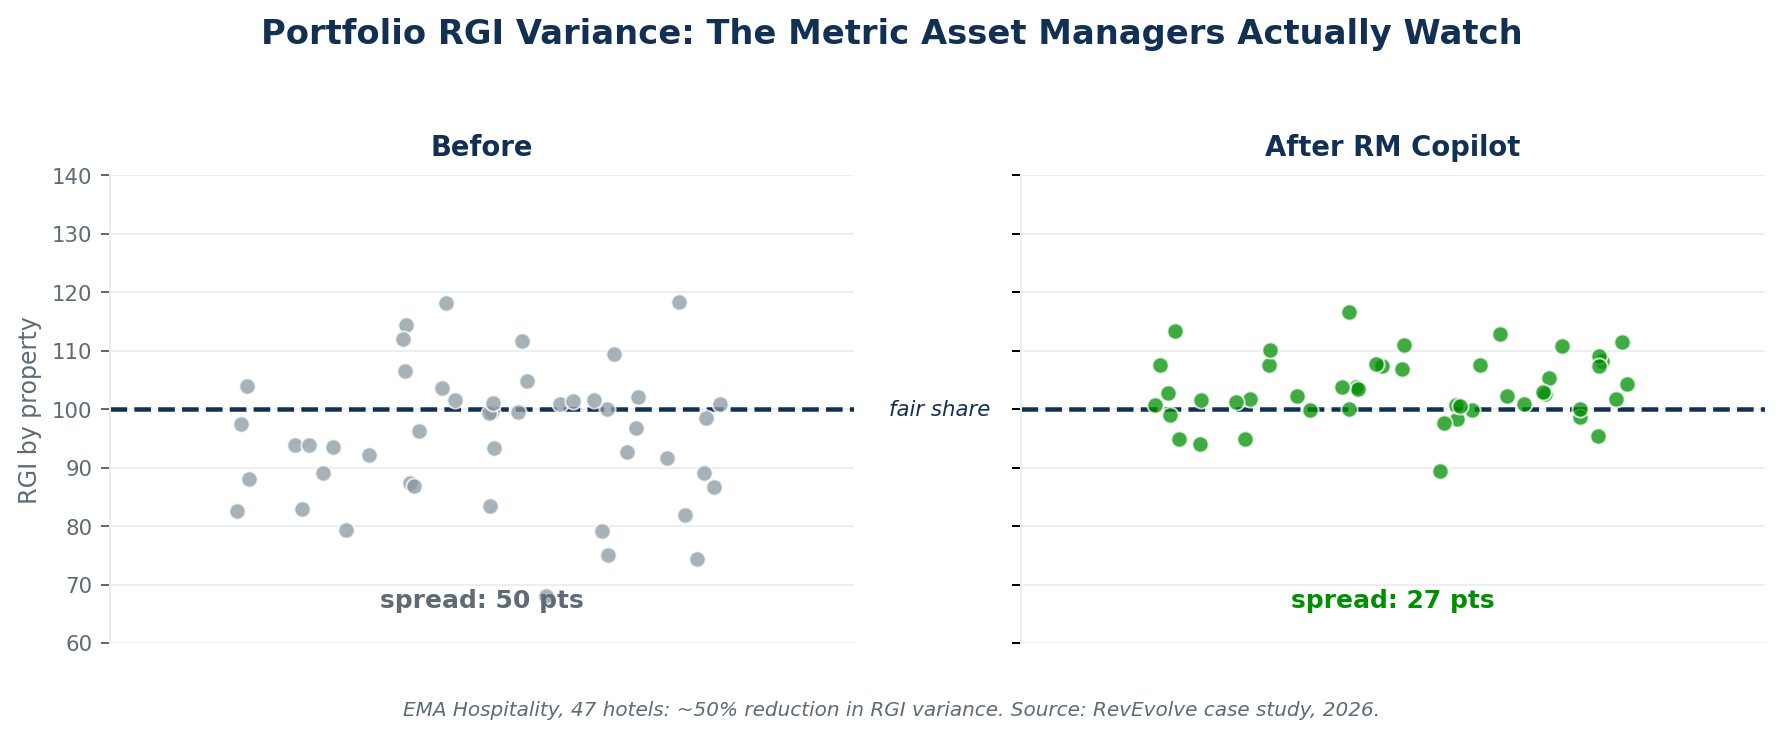
This is the metric asset managers actually watch, because variance is the thing they can act on. Across the EMA Hospitality portfolio — 47 hotels — RGI variance fell by roughly 50%, alongside a +3.2% RevPAR gain, about 18 hours per revenue manager per week recovered, and a six-month payback. The average moved modestly. The consistency moved a lot.
Tightening variance is mostly a process problem rather than a pricing one. When every property is priced by a different person applying different judgment on different days, spread is the guaranteed result. Applying the same analysis and the same recommendation logic across all of them — which is what a portfolio view with consistent recommendations provides — pulls the tails toward the middle.
How to Actually Move RGI
RGI is an output. You move it by moving one of its two inputs relative to the set — and by making sure the set is right in the first place.
- Validate the comp set before anything else. Every index is calculated against it, so a wrong comp set makes every number wrong with total confidence. If yours has not been reviewed in two years, review it before you change a single rate — see how to build one properly.
- Fix the quadrant you are actually in. Volume-led means raising the floor, not raising everything. Rate-led with a sub-100 RGI means you have overshot and need to open lower rate categories rather than cut BAR.
- Attack the dates, not the quarter. A quarter-level index that reads 94 is usually a handful of specific date types dragging an otherwise sound picture down.
- Watch the trend, not the week. Weekly index figures swing on group blocks, competitor renovations, and single events. The rolling 3-month and 12-month figures describe performance.
- Price forward, because the index is backward. RGI arrives after the room nights are sold. The only way to influence next quarter’s RGI is to price next quarter’s dates better than the set does.
From Reporting RGI to Changing It
Everything to this point is measurement. RGI describes how a period went relative to the set, in useful detail, after it has gone.
Improving it means winning the pricing decisions that produce next period’s number. RM Copilot analyzes demand and pace across your own PMS data, recommends the rate with the reasoning attached, and lets you simulate the projected occupancy and revenue impact before committing — your team reviews the recommendation and applies it. Across a portfolio, applying the same recommendation logic to every property is what pulls the RGI spread in.
The recommendation history matters here too. When an asset manager asks why property 19 sat below fair share for a quarter, a logged trail of what was recommended, what was applied, and why turns a defensive conversation into a factual one.
Worth separating two things people conflate: some hospitality AI is guest-facing — chat and messaging that help you talk to travelers. RM Copilot is operator-facing, working with your revenue team on the pricing decision itself.
Four Ways Teams Misread RGI
1 · Quoting RGI without MPI and ARI
The single most common error. RGI states that something happened; only the companion indices say what.
2 · Reacting to a single week
Weekly index swings are mostly noise. Judge the rolling figures.
3 · Assuming a stable index means stable performance
If your RGI held at 101 while the market grew 8%, you grew 8% too. That is not outperformance — it is keeping pace, which may or may not be the plan.
4 · Averaging RGI across a portfolio
Covered above. Report the spread and the outliers; the average conceals the properties that need attention.
Questions From the Ownership Call
Keep going: Hotel comp set analysis · RevPAR formula explained · Portfolio dashboard · Revenue management glossary.