Key takeaways
- GOPPAR = Gross Operating Profit ÷ Available Rooms (per period). For a 100-room hotel with $620,000 GOP in March, GOPPAR = $200.
- A hotel can have higher RevPAR than its comp set and lower GOPPAR — meaning higher revenue but worse profitability per room.
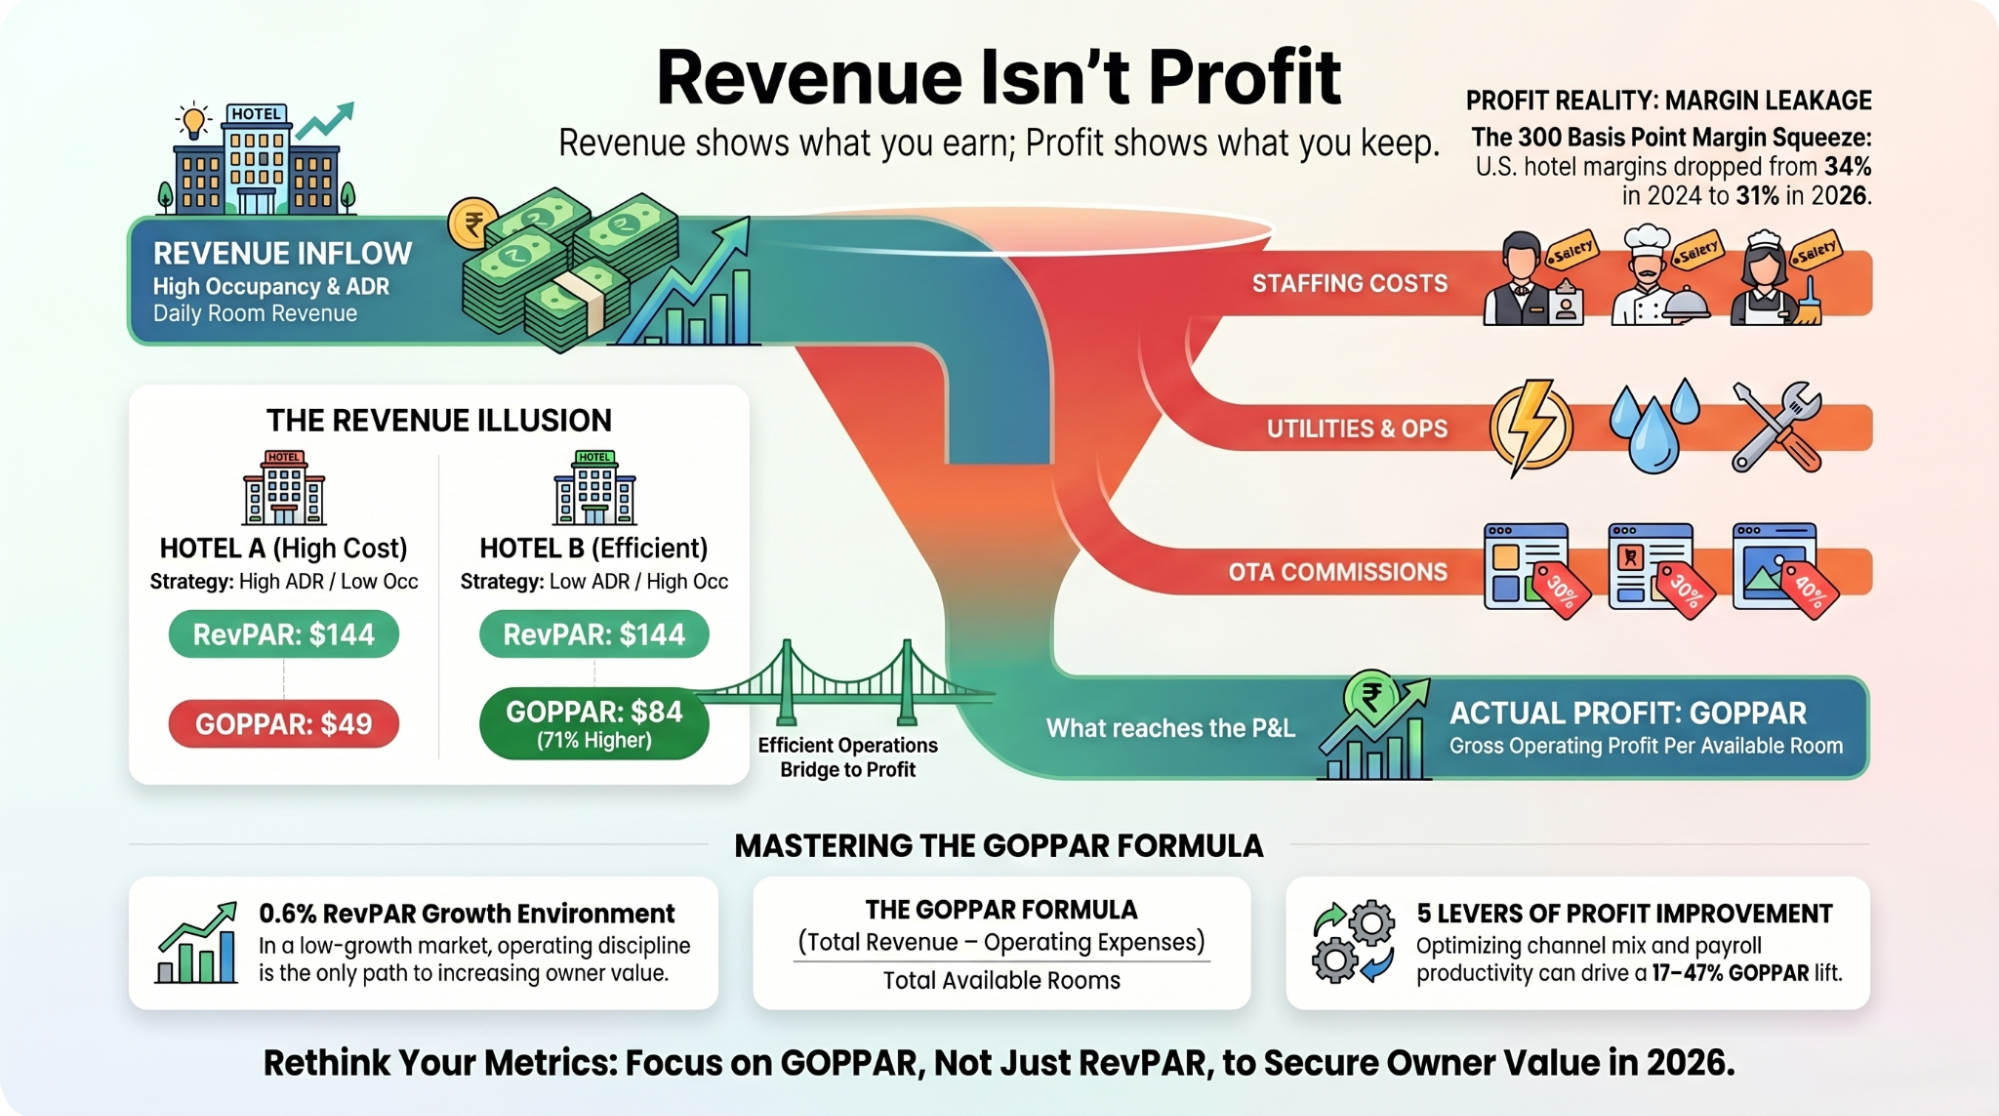
- U.S. hotel GOP margins compressed from ~34% in Q2 2024 to ~31% by Q1 2026 (HVS / CoStar trend), making GOPPAR the metric of the next 24 months.
- GOPPAR is improved by five levers: rate optimization, channel mix shift to direct, cost-of-acquisition reduction, payroll productivity, and ancillary revenue growth.
- For multi-property operators, GOPPAR variance across the portfolio is the single most actionable owner-facing metric — and the one revenue management software is now expected to report on, not just RevPAR.
→ Get the GOPPAR vs RevPAR Comparison PDF (printable cheat sheet for your owner reporting). Free download at revevolve.ai/resources/goppar-vs-revpar-pdf/.
What Is GOPPAR?
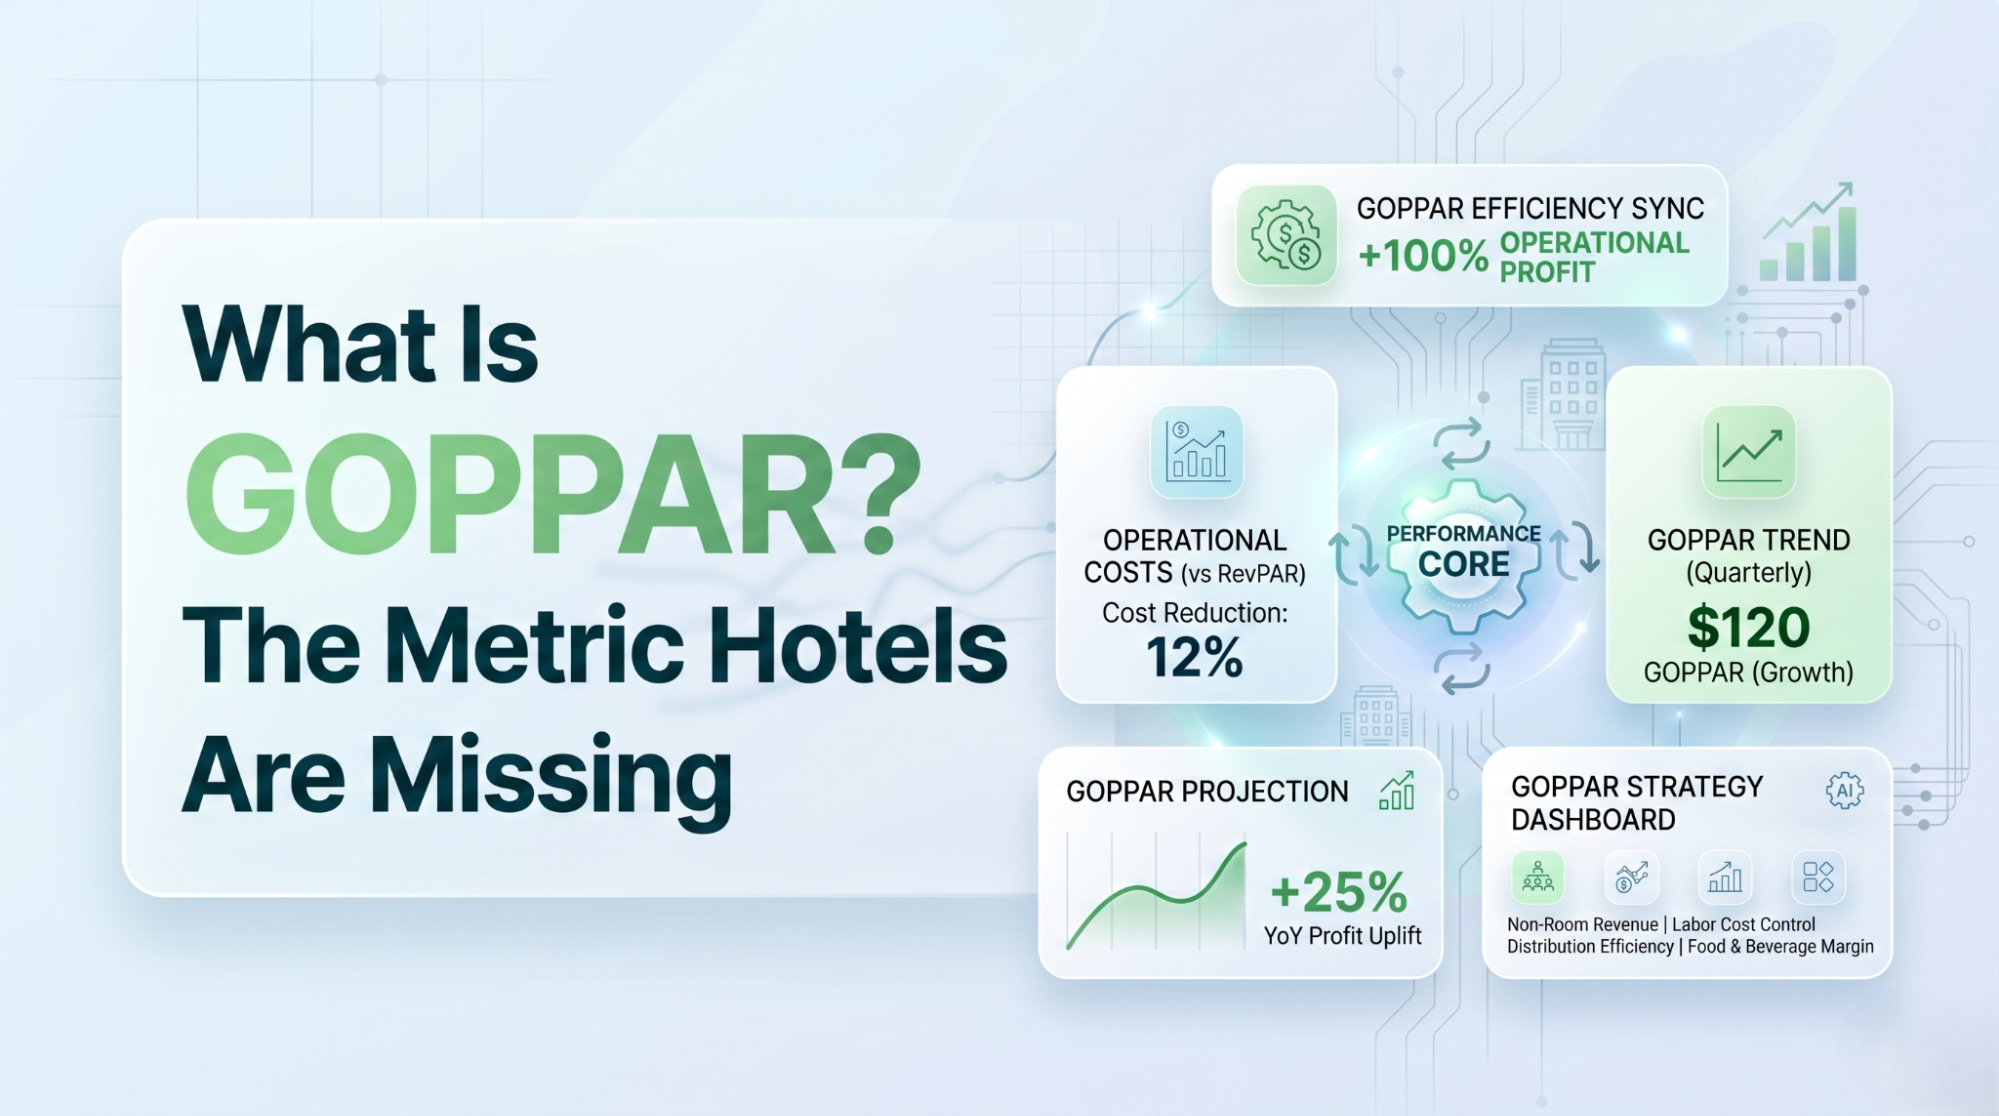
GOPPAR — Gross Operating Profit Per Available Room — is the per-room operating-profit metric used by hotel owners, asset managers, and lenders to compare property performance on a normalized, profitability-adjusted basis. It bridges the gap between revenue management metrics (RevPAR, ADR) that revenue managers operate on, and owner-level metrics (NOI, EBITDA) that financial stakeholders care about.
In plain language: RevPAR tells you how much top-line revenue each room generated. GOPPAR tells you how much profit each room generated after operating costs. Two hotels can have identical RevPAR and dramatically different GOPPAR. The one with the higher GOPPAR is the one the owner actually wants.
The metric was formalized by the Uniform System of Accounts for the Lodging Industry (USALI) — the accounting standard used by virtually all professionally operated hotels worldwide — and has been the standard owner-reporting metric in branded and luxury portfolios for over two decades. What is changing in 2026 is that independent hotels and small groups are now adopting GOPPAR as a primary metric, driven by margin compression that has made top-line-only management financially dangerous.
The GOPPAR Formula
GOPPAR = Gross Operating Profit ÷ Available Rooms
Where:
- Gross Operating Profit (GOP) = Total Revenue − Total Operating Expenses (before fixed charges, FF&E reserve, debt service, depreciation, and tax). This is the line on a USALI-compliant P&L typically labelled "Gross Operating Profit" or "House Profit."
- Available Rooms = Total room nights physically available to sell during the period (rooms × days), regardless of whether they were sold or occupied.
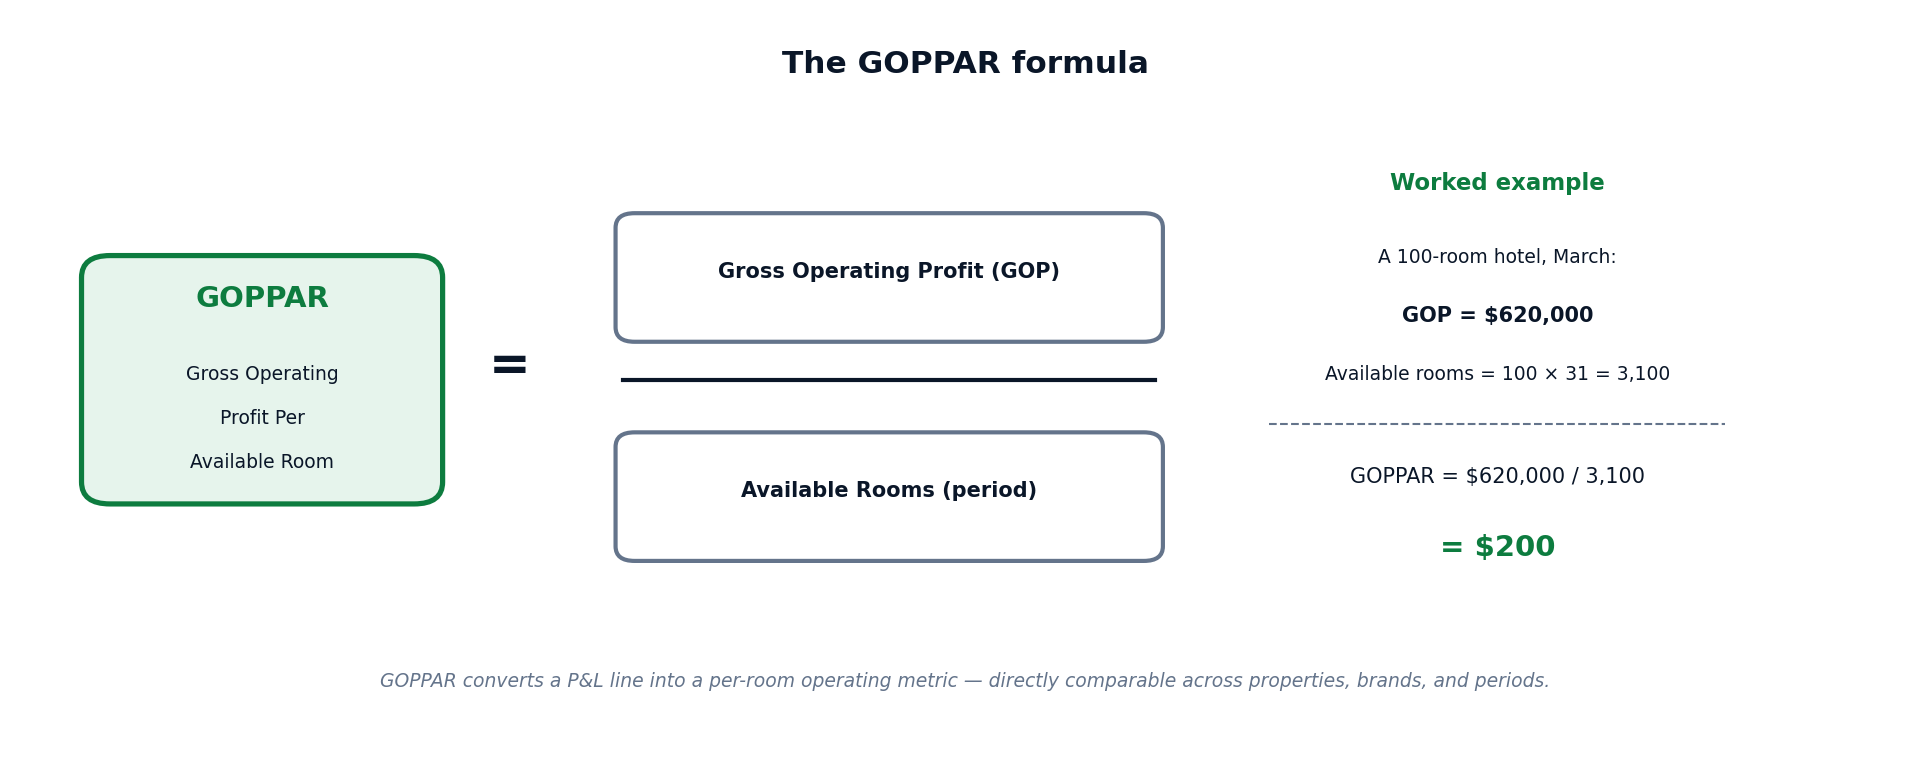
Worked example
A 100-room independent boutique hotel in Chicago, March 2026:
| Line | Amount |
|---|---|
| Room revenue | $920,000 |
| F&B revenue | $310,000 |
| Other revenue (spa, parking, ancillary) | $90,000 |
| <strong>Total revenue</strong> | <strong>$1,320,000</strong> |
| Departmental expenses (rooms, F&B, other) | $410,000 |
| Undistributed expenses (admin, sales, marketing, utilities, R&M) | $290,000 |
| <strong>Total operating expenses</strong> | <strong>$700,000</strong> |
| <strong>Gross Operating Profit (GOP)</strong> | <strong>$620,000</strong> |
| Available rooms (100 × 31) | 3,100 |
| <strong>GOPPAR</strong> | <strong>$200</strong> |
For the same hotel, RevPAR = $920,000 ÷ 3,100 = $297. The $97 gap between RevPAR ($297) and GOPPAR ($200) is the cost of running the property — the part that RevPAR-only management is blind to.
The Critical Difference: GOPPAR vs RevPAR
If you take one thing from this article, take this: two hotels with identical RevPAR can have very different GOPPAR. The one with the higher GOPPAR is the better-run hotel.
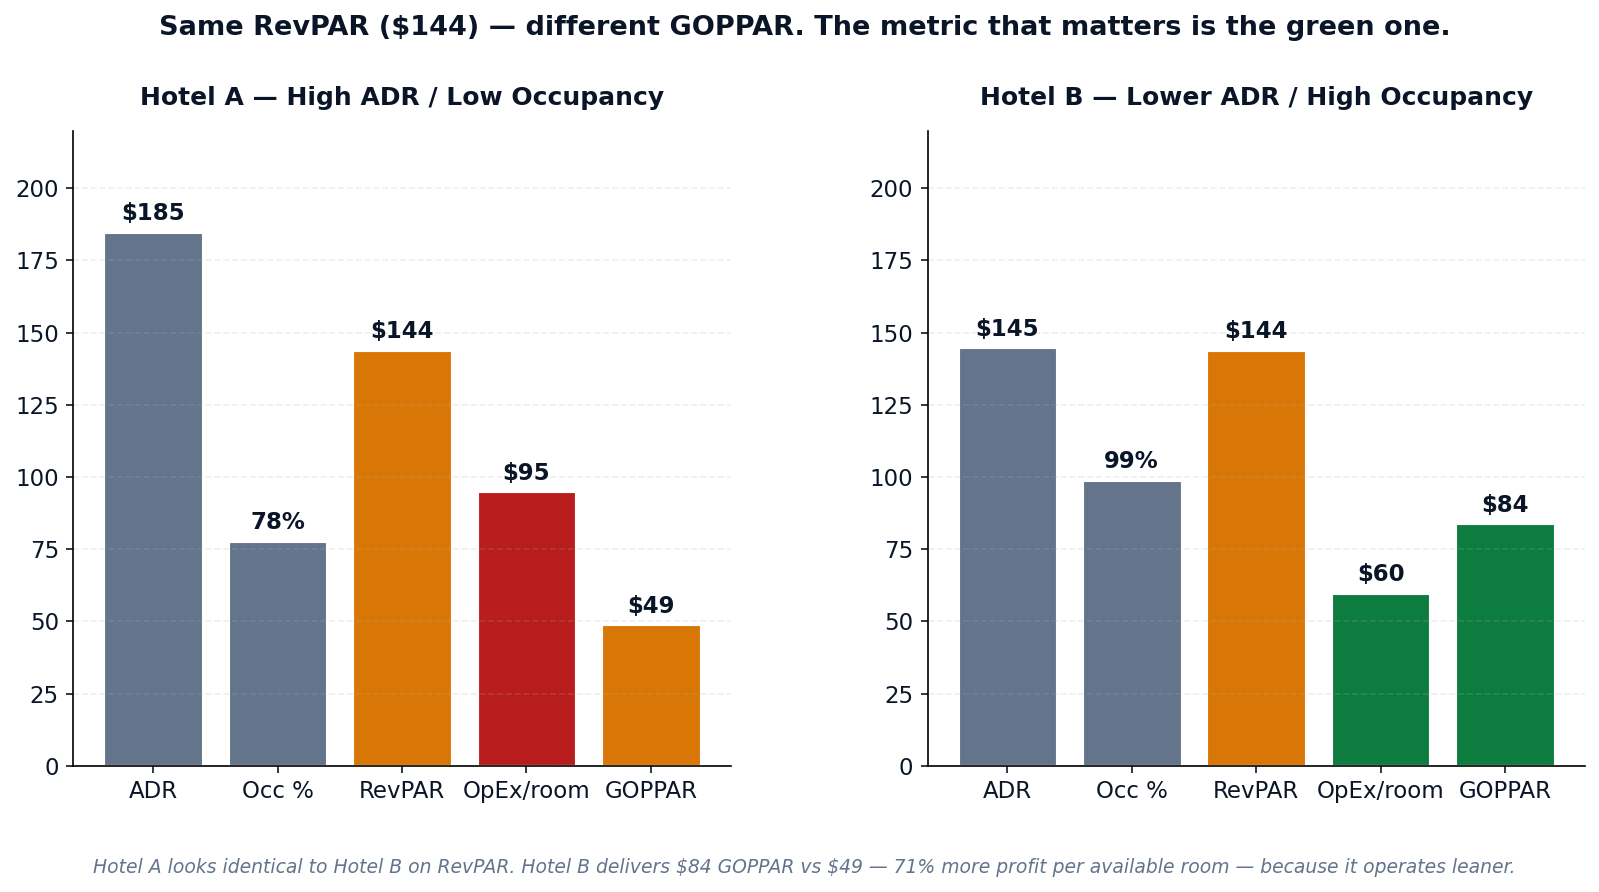
A worked comparison
Hotel A — High ADR / Low Occupancy strategy:
- ADR: $185 · Occupancy: 78% · RevPAR: $144
- Operating expenses per available room: $95
- GOPPAR: $49
Hotel B — Lower ADR / High Occupancy strategy:
- ADR: $145 · Occupancy: 99% · RevPAR: $144
- Operating expenses per available room: $60
- GOPPAR: $84
Same RevPAR. Hotel B delivers 71% more profit per available room than Hotel A. Why? Hotel A is filling fewer rooms at higher rates, but the rooms it does fill carry higher cost-of-acquisition (more OTA dependency, more commission, more discounting friction). Hotel B is running closer to capacity, where fixed-cost absorption is far better and per-room operating expense drops sharply.
A revenue manager optimizing for RevPAR alone cannot tell these two hotels apart. An owner cares about exactly one of them — Hotel B.
When RevPAR misleads
Three scenarios where RevPAR-only management costs hotels real money:
- High-rate, high-cost-of-acquisition strategies. A hotel that pushes ADR via aggressive OTA placement may show RevPAR growth while GOPPAR falls — because every incremental room came in at 25% commission against 8% direct.
- Discounted occupancy that erodes margin. Filling rooms at rates below break-even ADR maintains RevPAR optically but destroys GOPPAR. Most ML-recommendation RMS tools will gladly recommend these rates if you don’t constrain them on cost.
- F&B and ancillary blind spots. A resort with strong restaurant and spa revenue can have mediocre RevPAR and excellent GOPPAR. Running the property as a "RevPAR property" suppresses the highest-margin revenue streams.
The 4-Metric Hospitality Performance Hierarchy
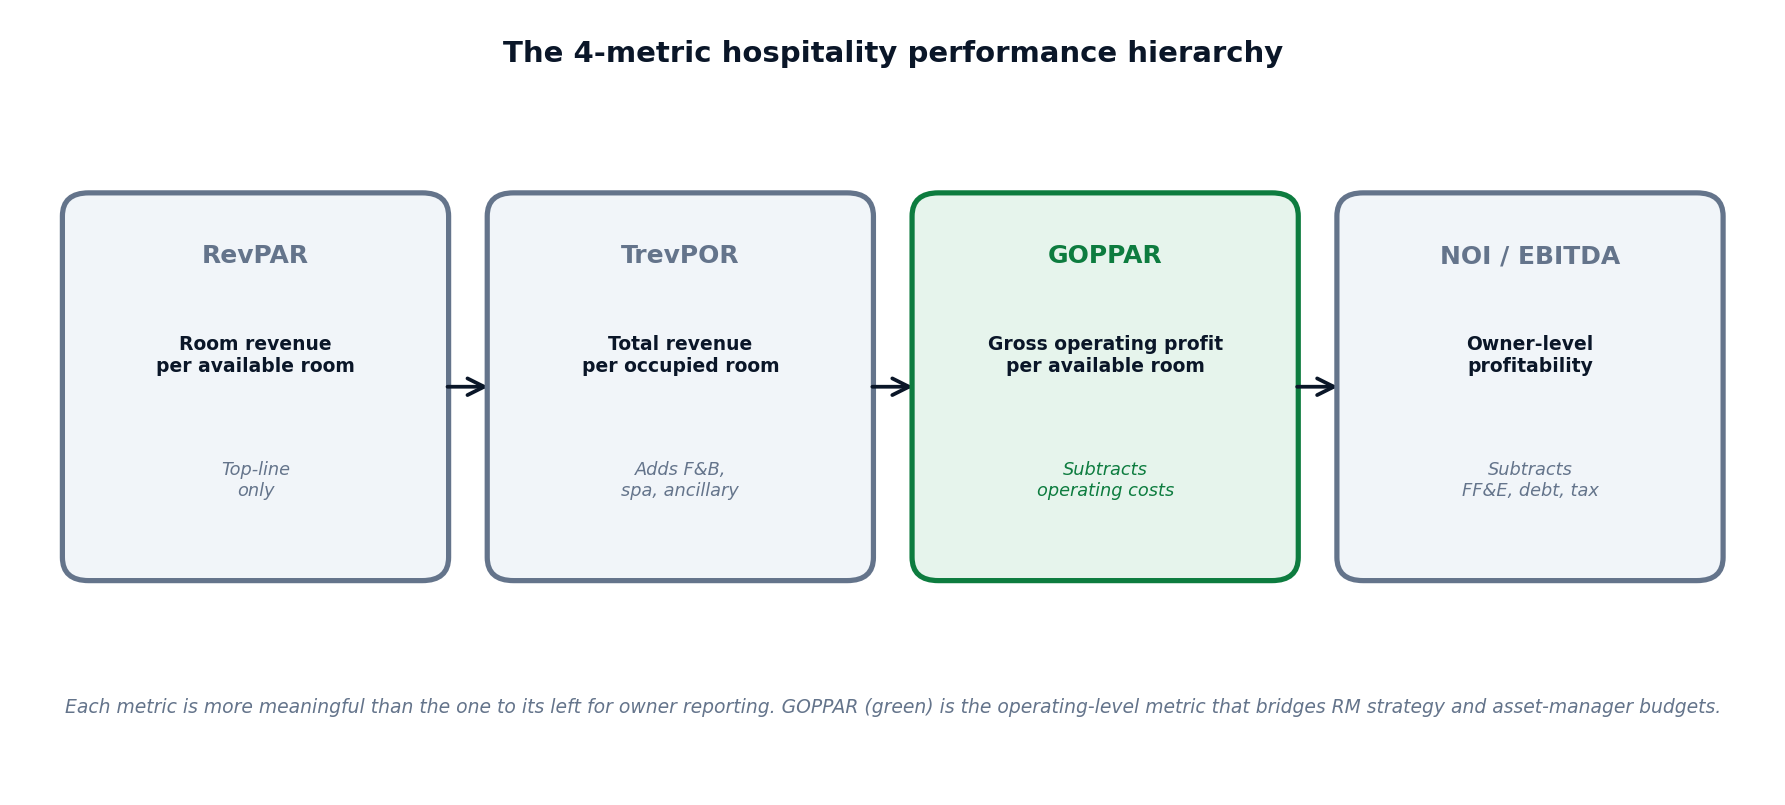
GOPPAR sits in a four-metric hierarchy that progresses from top-line indicator to owner-level profitability. Each metric is more meaningful than the one to its left for owner-facing reporting and asset-manager budget conversations.
| Metric | Formula | What it captures | Who uses it |
|---|---|---|---|
| RevPAR | Room revenue ÷ Available rooms | Top-line room revenue only | Revenue managers, GMs |
| TrevPOR | Total revenue ÷ Occupied rooms | Total revenue including F&B, spa, ancillary | RMs at resorts; F&B-heavy hotels |
| GOPPAR | Gross Operating Profit ÷ Available rooms | Operating profit per room, after departmental and undistributed costs | Asset managers, owners, lenders |
| NOI / EBITDA | (GOP − fixed charges − FF&E reserve) ÷ — | Owner-level profitability | Owners, investors, analysts |
The point of GOPPAR’s position in this hierarchy is its bridging function. A revenue manager managing toward GOPPAR is making decisions that map directly to the owner’s P&L — which is what asset managers and lenders want to see. RevPAR-only management makes the revenue manager’s job easier; GOPPAR-aware management makes the owner’s job easier.
Why GOPPAR Matters More in 2026 Than Ever Before
Three structural shifts have made GOPPAR the metric of the next two years:
1. GOP margins are compressing across every property type
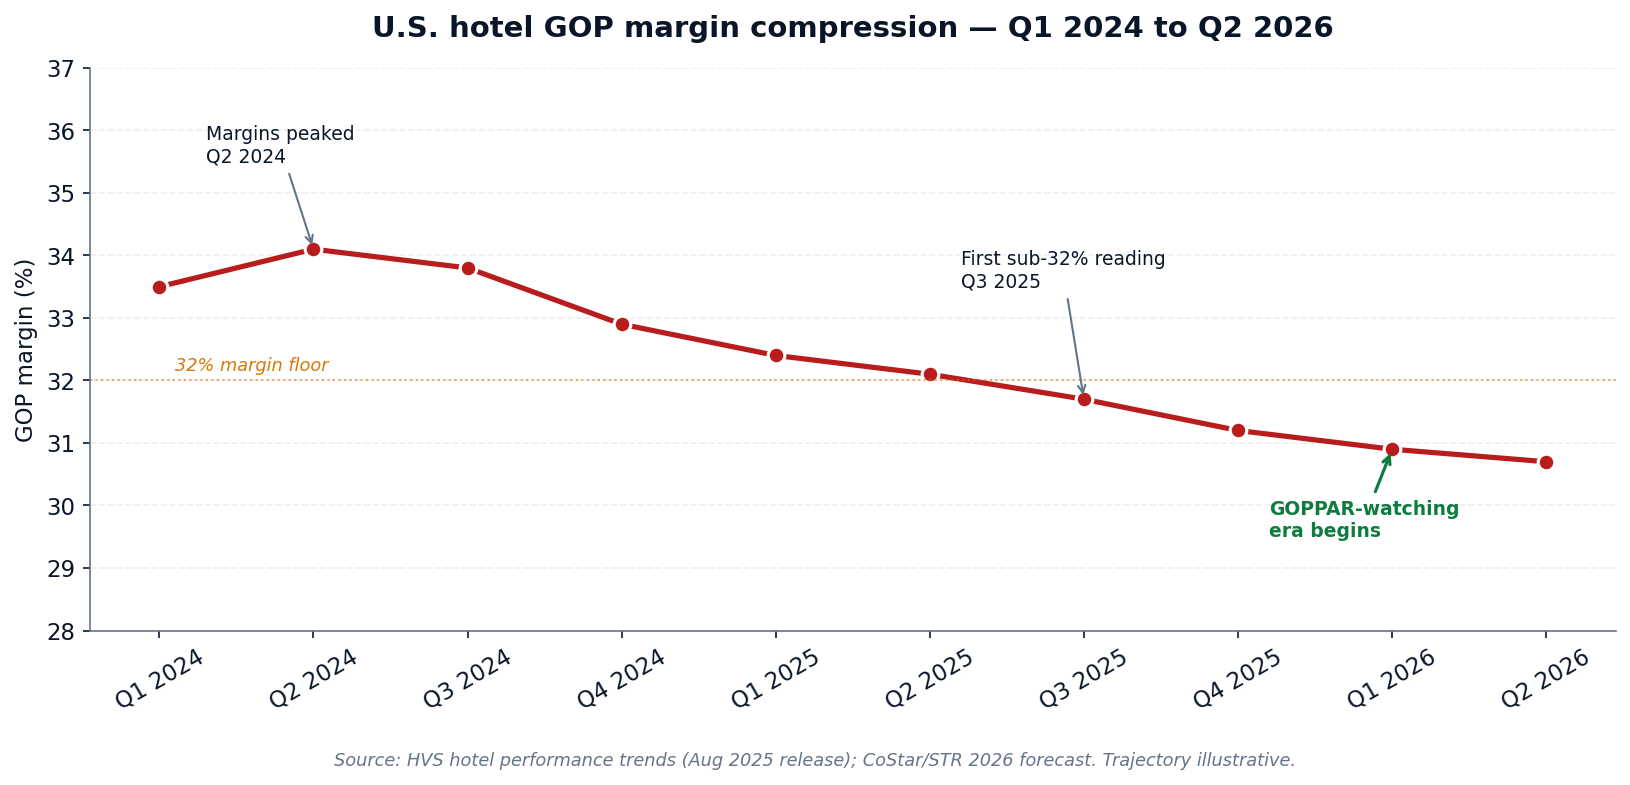
Per HVS hotel performance trends (August 2025) and CoStar/STR forecast data, U.S. hotel GOP margins have compressed roughly 300 basis points from the 2024 peak. Wages, insurance premiums, brand fees, and utilities have all permanently reset higher. Revenue growth has not kept pace: U.S. hotel RevPAR declined 0.3% in 2025 and is forecast to grow just 0.6% in 2026 — the worst non-recessionary RevPAR environment on record.
When margins compress, the difference between hotels that "make their numbers" and hotels that don’t is no longer top-line revenue. It is operating discipline, captured by GOPPAR.
2. Owners and lenders are demanding GOPPAR-level reporting
Branded and luxury portfolios have always reported in GOPPAR. What has changed is that independent owners, hotel groups, and lenders financing acquisitions are now requiring GOPPAR as a standard reporting line — not just RevPAR. Asset managers managing on behalf of equity partners cannot defend a property’s performance using RevPAR alone in 2026; they need the operating-profit lens.
3. The 0.6% RevPAR growth environment forces operating discipline
A 0.6% RevPAR growth environment means revenue managers cannot revenue-grow their way to higher profits. The only path to GOPPAR improvement in this environment is better revenue mix (channel, segment, length-of-stay) and leaner operating execution — both of which are GOPPAR-native concerns, not RevPAR-native.
How to Calculate GOPPAR — Step by Step
Use this five-step process to calculate GOPPAR accurately and consistently across your portfolio:
- Step 1 — Total your revenue for the period. Add all revenue streams: rooms, F&B (broken out by outlet if useful), spa, parking, retail, fees, and other ancillary. Use USALI revenue line definitions to ensure consistency across periods and properties.
- Step 2 — Total your departmental operating expenses. Departmental expenses are the costs incurred to deliver each revenue line. Rooms department expenses (housekeeping, front desk, supplies). F&B department expenses (cost of goods, labor, supplies). Other departments similarly.
- Step 3 — Total your undistributed operating expenses. Undistributed expenses are property-wide costs not tied to one revenue line: administrative & general (A&G), sales & marketing, IT, utilities, repairs & maintenance, franchise fees (where applicable).
- Step 4 — Calculate Gross Operating Profit. GOP = Total revenue − Departmental expenses − Undistributed expenses. This is the line on a USALI P&L typically labelled "Gross Operating Profit" or "House Profit." It excludes fixed charges (property tax, insurance, base rent), FF&E reserve, debt service, depreciation, and tax — all of which are owner-level rather than operating-level concerns.
- Step 5 — Divide by available rooms in the period. Available rooms = total rooms in the property × days in the period. For a 100-room hotel in a 31-day month: 100 × 31 = 3,100 available rooms. GOPPAR = GOP ÷ Available rooms.
Three calculation traps to avoid
- Don’t subtract fixed charges. GOPPAR is a gross-operating-profit metric, not a net metric. Property tax, insurance, FF&E reserve, debt service, and depreciation belong below the GOP line. Include them and you are calculating something closer to NOI per available room — useful, but not GOPPAR.
- Use available rooms, not occupied rooms. GOPPAR is a per-available-room metric (like RevPAR). TrevPOR uses occupied rooms. Mixing them gives you a comparable that doesn’t normalize against capacity.
- Standardize on USALI line definitions across the portfolio. GOPPAR comparisons across properties are only meaningful if the underlying P&L lines are categorized the same way. A property booking franchise fees as departmental rather than undistributed will show inflated GOPPAR vs comparable USALI-compliant properties.
The 5 Levers to Improve GOPPAR
GOPPAR improvement is a function of revenue and cost. Pulling any of these five levers raises it:
Lever 1 — Rate optimization at the segment and channel level
Optimizing pricing per segment and channel (rather than a single BAR) raises blended ADR while protecting volume. Open Pricing strategies, agentic-AI pricing, and per-channel rate fences all serve this lever.
Expected GOPPAR lift: 5–12% over 12 months.
Lever 2 — Channel mix shift toward direct booking
Direct bookings carry zero distribution commission. Shifting 5 percentage points of room revenue from OTA (typically 18–25% commission) to direct booking improves GOPPAR by 0.9–1.25 percentage points of revenue — without any rate change.
Expected GOPPAR lift: 3–8% over 12 months.
Lever 3 — Cost-of-acquisition reduction
Reducing OTA commission tier (negotiating lower rates), cutting paid-search waste, and shifting marketing spend toward higher-ROI channels lowers cost per booking.
Expected GOPPAR lift: 2–5% over 12 months.
Lever 4 — Payroll productivity
Hotel labor is the single largest variable operating cost. Productivity gains — task automation, multi-skilled staffing, AI-assisted scheduling — directly improve GOPPAR. The introduction of agentic AI in revenue management is one specific case of this lever: when one revenue manager can run 22+ properties instead of 3–5, fixed RM payroll is amortized across far more rooms.
Expected GOPPAR lift: 3–10% over 12 months at portfolio scale.
Lever 5 — Ancillary revenue growth
F&B, spa, parking, retail, and resort-fee revenue typically carry higher contribution margins than room revenue. Growing these revenue lines without proportional cost growth raises GOPPAR meaningfully — particularly at resorts and full-service properties.
Expected GOPPAR lift: 4–12% over 12 months.
The compounding effect: a property that pulls all five levers conservatively (low end of each range) sees a cumulative GOPPAR improvement in the range of 17–47% over 12 months. This is why portfolio-level GOPPAR variance is the single most actionable metric for asset managers — the gap between the best and worst properties in a portfolio is rarely a market problem; it is an operating-discipline problem.
→ See RevEvolve’s Portfolio Dashboard — the operator-facing dashboard that tracks GOPPAR variance across your properties in real time, with attribution to which lever moved (or didn’t).
Common GOPPAR Mistakes Hotels Make
Five errors we see consistently when reviewing operator GOPPAR reporting:
- Mistake 1 — Using GOPPAR as the only metric. GOPPAR is the bridge metric — it is not the only metric. Revenue managers still need RevPAR for strategy, occupancy for pace, and ADR for positioning. GOPPAR sits on top of these as the owner-facing summary.
- Mistake 2 — Comparing GOPPAR across non-USALI-compliant properties. A property that books franchise fees as departmental and a comparable property that books them as undistributed will show different GOPPAR — even with identical operations. Standardize the USALI mapping before comparing.
- Mistake 3 — Targeting GOPPAR without capacity context. A property running at 95% occupancy with $180 GOPPAR may have less upside than a comparable property running at 70% occupancy with $140 GOPPAR. Always pair GOPPAR with occupancy and RevPAR for context.
- Mistake 4 — Ignoring seasonality in GOPPAR comparisons. GOPPAR is highly seasonal at most properties. Compare like-for-like periods (March 2026 vs March 2025), not month-on-month.
- Mistake 5 — Failing to attribute GOPPAR variance to a lever. Saying "GOPPAR fell $14" is descriptive. Saying "GOPPAR fell $14, driven by $11 from OTA mix shift and $3 from utilities cost" is actionable. Modern portfolio dashboards (including RevEvolve’s) attribute GOPPAR movement to specific drivers automatically.
GOPPAR Benchmarks by Property Type (2025–2026)
GOPPAR varies materially by property type, market, and seasonality. The table below is directional rather than absolute — use it to triangulate where your property sits:
| Property type | Typical GOPPAR range (annual avg, USD) |
|---|---|
| Limited-service / select-service | $40 – $90 |
| Mid-scale / upper mid-scale | $70 – $130 |
| Full-service upscale | $110 – $200 |
| Luxury / ultra-luxury | $180 – $380+ |
| Resort (with significant ancillary) | $150 – $400+ |
Source: composite of HotStats, STR/CoStar, and HVS benchmarking ranges; figures rounded for illustration.
The single most useful comparable for any property is its own portfolio peers — properties of the same class, market, and brand operating model. Industry-average benchmarks are starting points; portfolio-specific benchmarks are operating standards.
Conclusion — In a Margin-Compressed Industry, GOPPAR Wins
RevPAR was the metric of the growth era. From 2010 through 2024, U.S. hotels could measure success by top-line revenue per room and roughly map that back to profitability. That era ended in 2025.
In 2026, with RevPAR forecast to grow 0.6% and GOP margins still compressing, the hotels that win are not the ones with the highest RevPAR. They are the ones with the highest GOPPAR — and the ones whose revenue managers, GMs, and asset managers all agree on it as the metric of record.
GOPPAR is the bridge between the revenue manager’s daily decisions and the owner’s quarterly P&L. Track it, optimize for it, attribute movement in it to specific levers, and benchmark it across your portfolio peers. The properties that do this well will outperform their comp set in the margin-compressed environment of 2026–2030. The properties that don’t will look fine on RevPAR and still miss their owner’s NOI target — and won’t know why.
Stop reporting on RevPAR alone in 2026.
→ See RevEvolve’s Portfolio Dashboard — track GOPPAR variance across every property in your portfolio in real time, with attribution to the lever that moved it. 15-minute walkthrough.
→ Download the GOPPAR vs RevPAR Comparison PDF — printable cheat sheet for your owner reporting.