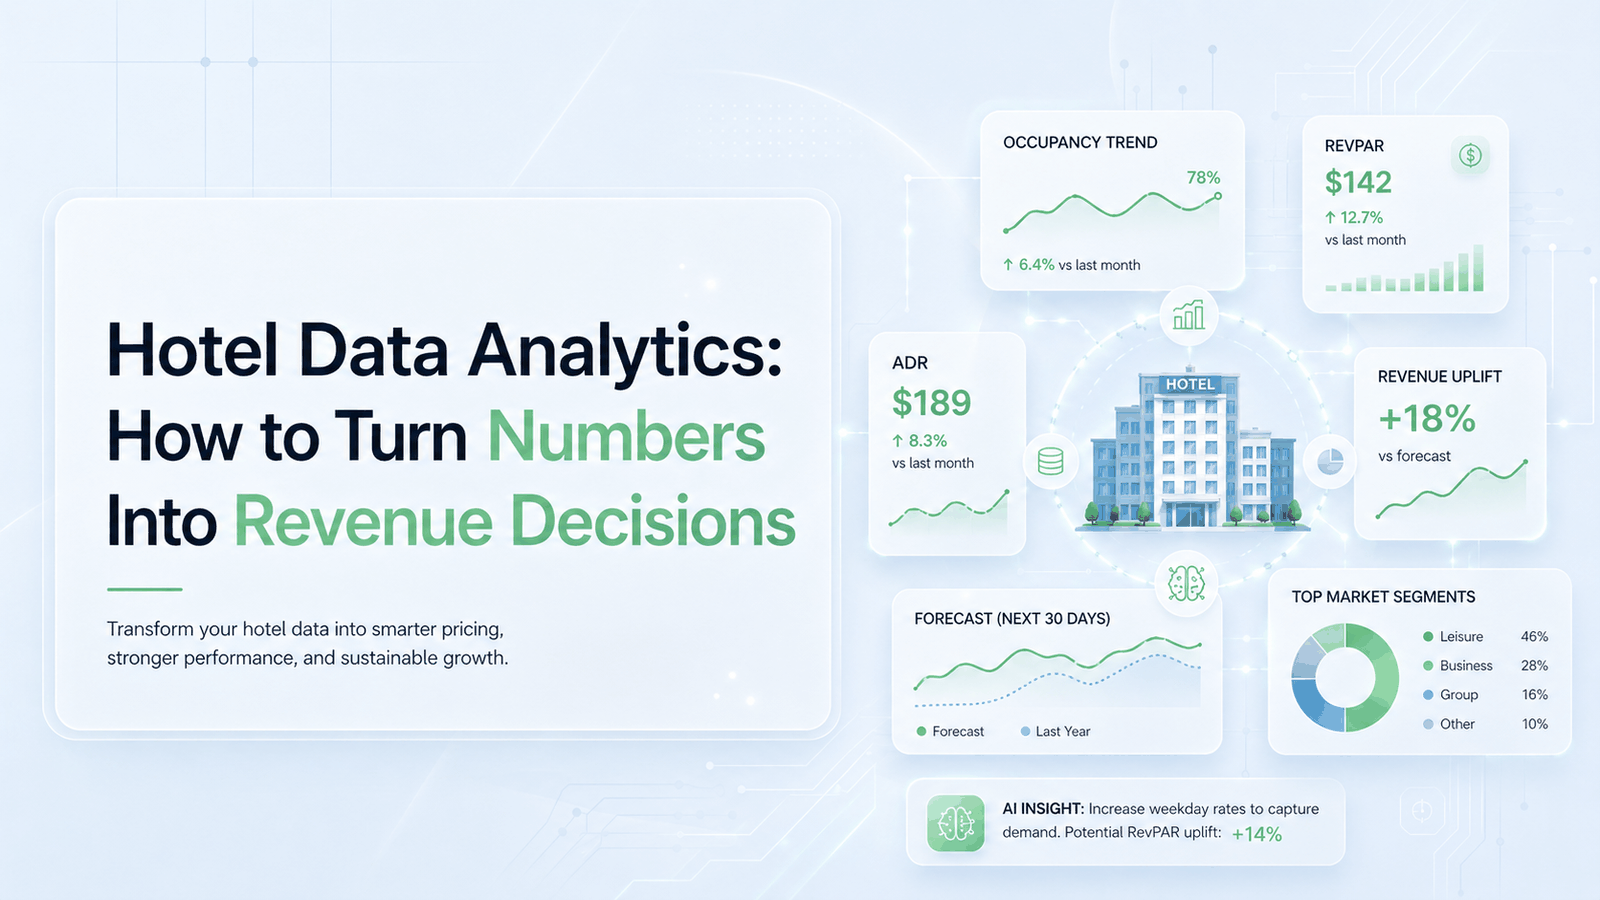
SNIPPET DEFINITION — Hotel data analytics is the discipline of integrating fragmented data from 8 sources — PMS, channel manager, OTAs, rate-shopping tools, booking engine, POS/F&B, web analytics, and CRM — cleaning it for accuracy, organizing it by metric hierarchy, and converting it into specific revenue decisions: rate updates, channel mix adjustments, comp set calibrations, segment forecasts. The goal is not dashboards — the goal is decisions. Hotels operating at Tier 4 of the analytics maturity model (prescriptive, autonomous) save ~85% of weekly RM time and deliver +13.7% RevPAR vs Tier 1–2 manual workflows.
22% of our website traffic was fake. We made real business decisions based on garbage data for months. The damage: $4,200 wasted on Google Ads increases based on inflated numbers. Conversion rate looked 2.5% (with junk traffic) vs actual 3.2%. Almost fired their marketing agency over a wrong number.
Key takeaways
- Hotel data lives in 8 fragmented sources — PMS (22%), channel manager/OTAs (18%), comp set tools (14%), booking engine (11%), POS/F&B (11%), web analytics (10%), CRM (8%), accounting (6%). Most operators have all 8; few have them integrated.
- Garbage data in, garbage decisions out: 22% of typical hotel website traffic is bots or fake. Channel attribution is usually last-click only. Comp sets drift annually without review. Decisions look mathematically correct but are aimed at the wrong target.
- The metric hierarchy that matters: Tier 1 daily (bookings, ADR, OTA mix, direct conversion, pickup pace), Tier 2 weekly (RGI position, F&B per guest), Tier 3 monthly (repeat rate, cancellation, channel cost), Tier 4 quarterly (length of stay, booking window distribution).
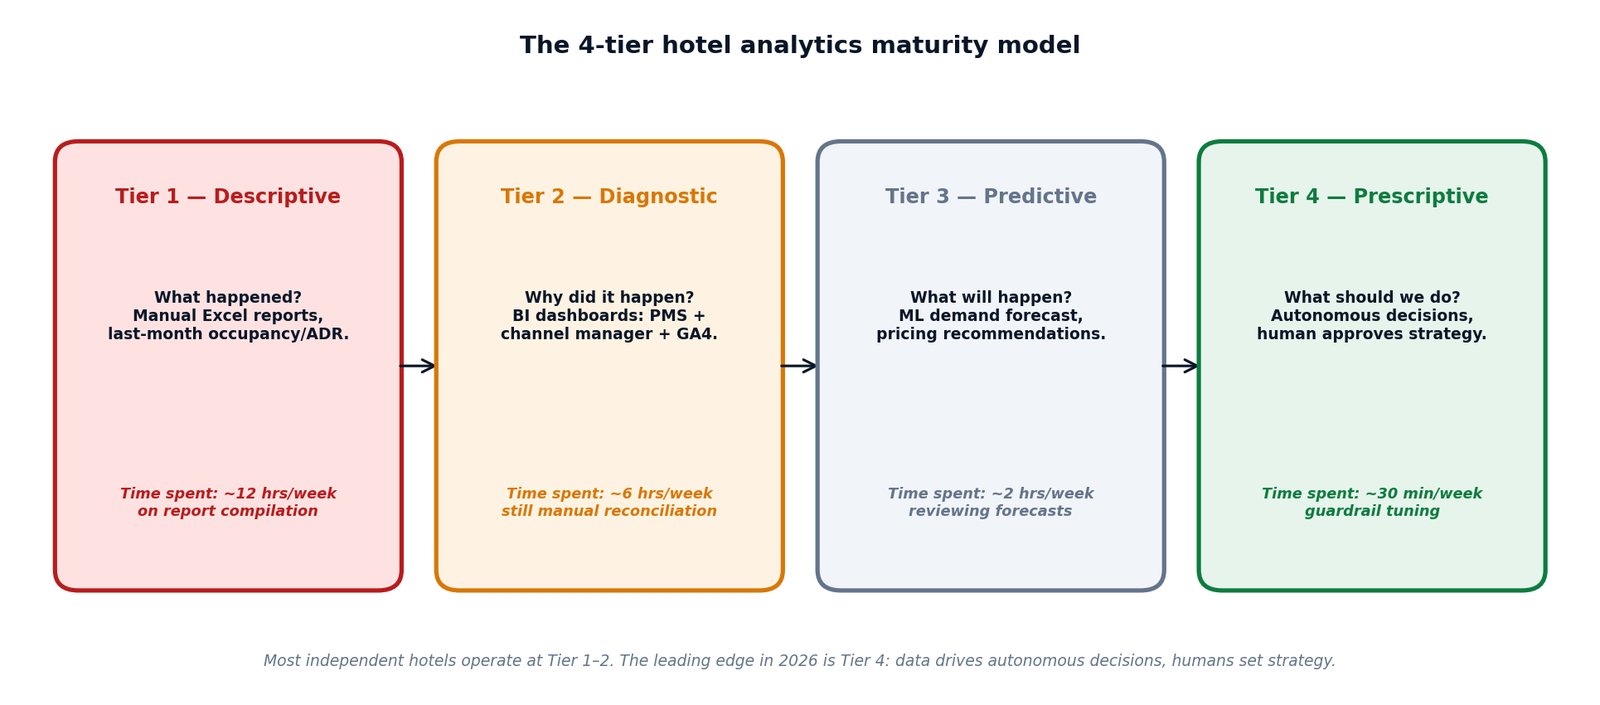
- The 4-tier analytics maturity model: Descriptive ("what happened") → Diagnostic ("why did it happen") → Predictive ("what will happen") → Prescriptive ("what should we do"). Most independents are at Tier 1–2. The leading edge is Tier 4.
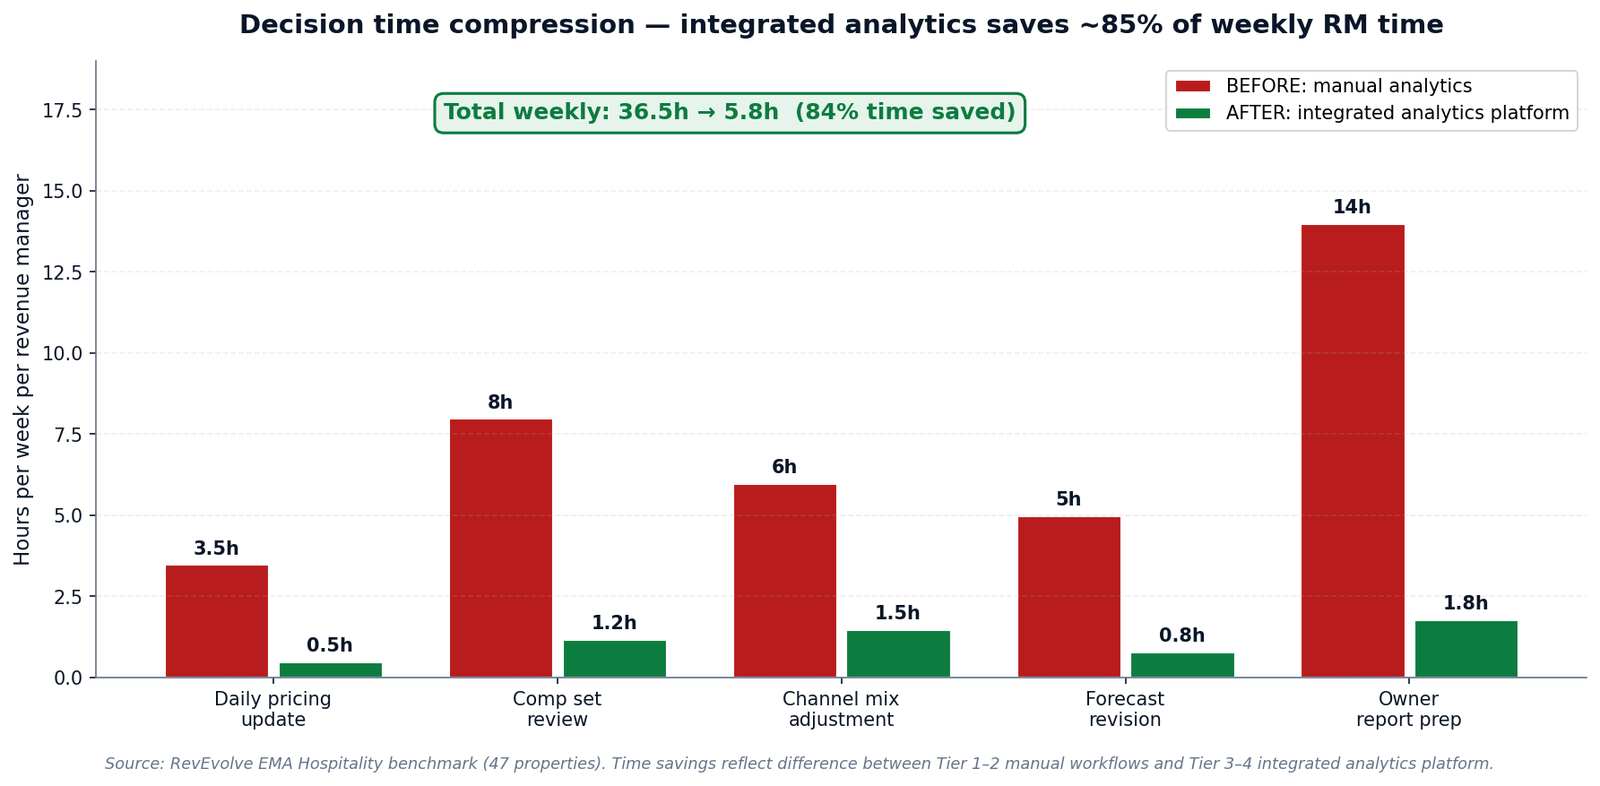
- Time savings are dramatic: integrated analytics compresses weekly RM time from 36.5 hours to 5.8 hours — an 84% reduction.
- Decision quality scales with data quality: clean attribution + multi-touch + integrated cross-source data = +9–13% RevPAR lift vs unclean baseline.
→ See RevEvolve’s Portfolio Dashboard in action — all 8 data sources unified, cleaned, organized by decision tier, and connected to autonomous execution. 15-minute walkthrough.
What Is Hotel Data Analytics?
Hotel data analytics is the practice of converting raw operational data into specific revenue decisions. The discipline has four steps: collect (integrate fragmented data from 8 sources), clean (filter bots, fix attribution, reconcile across systems), organize (rank metrics by decision impact, structure by review cadence), decide (translate insight into rate moves, channel adjustments, forecasting updates).
The most common failure mode is to stop at step 3. Hotels invest in BI dashboards that show 47 metrics across 12 KPIs — and then make decisions the same way they did before the dashboard. Dashboards without decision integration are expensive wallpaper.
Modern hotel analytics in 2026 closes the gap between insight and action through four disciplines:
- Data integration — unify the 8 fragmented data sources into one operator-facing dashboard with consistent metric definitions and reconciled timestamps.
- Data quality — filter bots, normalize attribution, detect outliers, flag anomalies before they reach the decision layer.
- Metric hierarchy — organize the 12 most decision-critical metrics by review cadence so the right team member sees the right metric at the right time.
- Decision integration — connect insights to action: when occupancy pace lags, the system recommends (or executes) a rate adjustment; when comp set drifts, the system flags a review; when channel mix shifts, the system rebalances.
Lighthouse, OTA Insight, and most established hotel analytics tools deliver excellent execution on disciplines 1–3. They are diagnostic dashboards. RevEvolve’s Portfolio Dashboard is built for discipline 4 — connecting insight to action. The product category is different: dashboard vs decision engine.
Where Hotel Data Lives — The 8 Fragmented Sources
Before analytics, the diagnostic. Hotel data lives across 8 systems that rarely talk to each other natively. Most properties have all 8; few have them integrated into a single decision view.
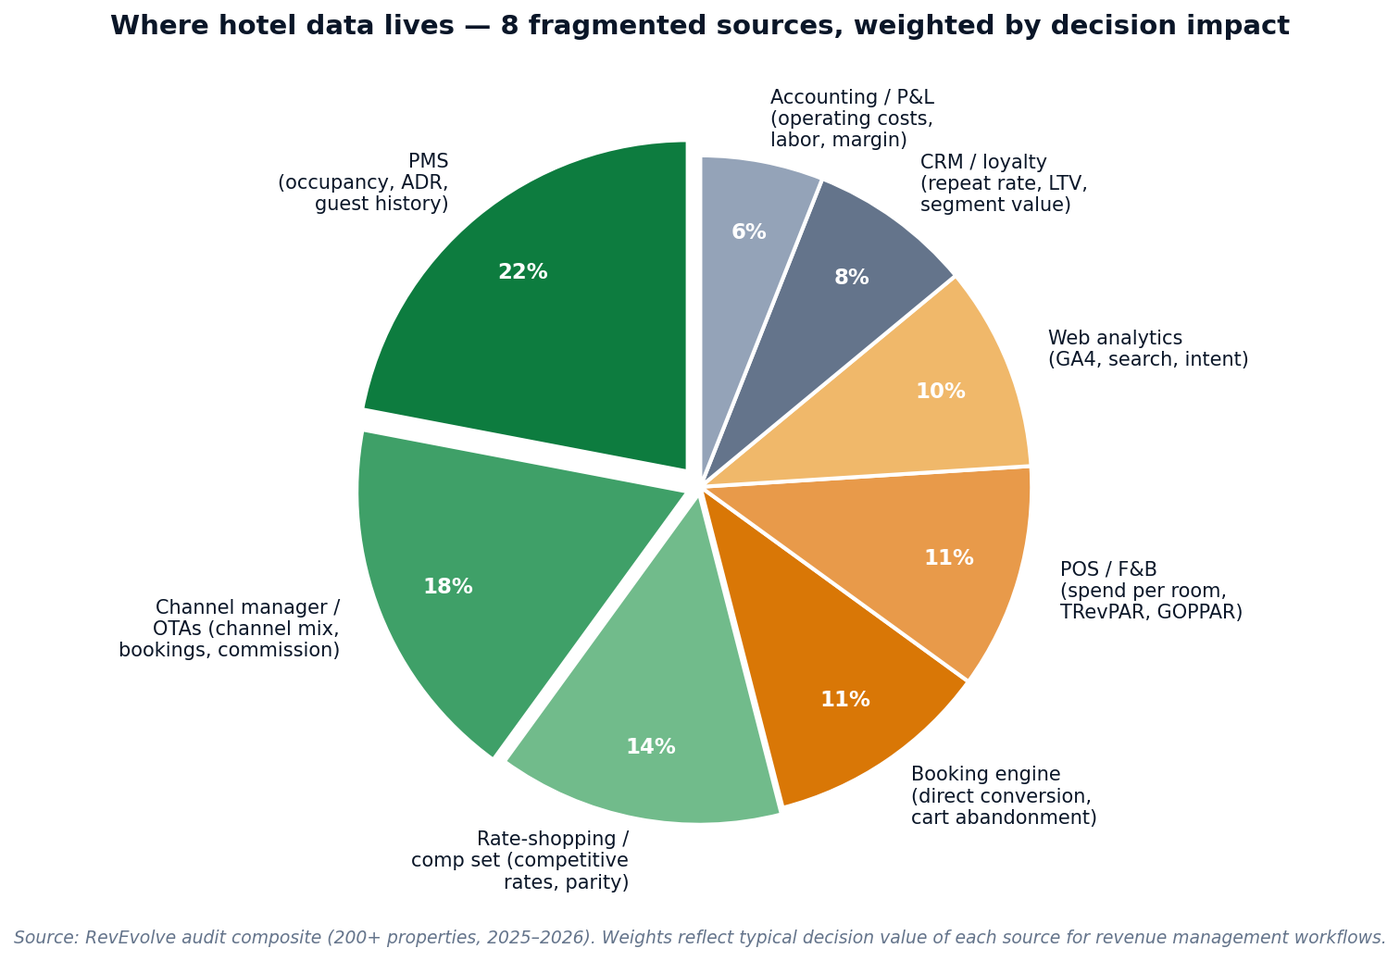
| Source | Decision impact | What it tells you | Common gaps |
|---|---|---|---|
| PMS | 22% | Occupancy, ADR, guest history, room type mix, length of stay | Doesn’t talk to channel manager natively |
| Channel manager / OTAs | 18% | Channel mix, OTA bookings, commission paid, parity violations | No GOPPAR view; commission reconciliation lag |
| Rate-shopping / comp set | 14% | Competitive rates, comp set position (RGI), parity status | Manual setup; comp set drift; expensive at scale |
| Booking engine | 11% | Direct conversion rate, cart abandonment, member rate uptake | Often disconnected from web analytics |
| POS / F&B systems | 11% | Spend per occupied room, F&B cover counts, package usage | Rarely integrated with PMS revenue lines |
| Web analytics (GA4) | 10% | Search demand, traffic quality, intent signals, source attribution | Bot/fake traffic, last-click only attribution |
| CRM / loyalty | 8% | Repeat guest %, member LTV, segment value, channel preference | Often siloed from PMS guest history |
| Accounting / P&L | 6% | Operating costs, labor cost ratio, GOPPAR, departmental margin | Monthly cadence too slow for daily RM decisions |
Why does every hotel software vendor promise "seamless integration" when nothing actually integrates? Three months later I’m still manually entering the same guest information into four different systems because nothing actually talks to each other. Revenue management doesn’t sync with the PMS, the booking engine lives in its own universe.
The integration problem is the analytics problem. A revenue manager who has to log into 8 systems to compile one weekly report cannot make data-driven decisions — they can barely make data-aware decisions.
Data Quality: Garbage In, Garbage Decisions Out
The most expensive analytics mistake is not missing a metric — it’s making confident decisions on uncleaned data. Hotels routinely make budget allocations, marketing investments, and pricing changes based on numbers that are 20–30% wrong before the math even starts.
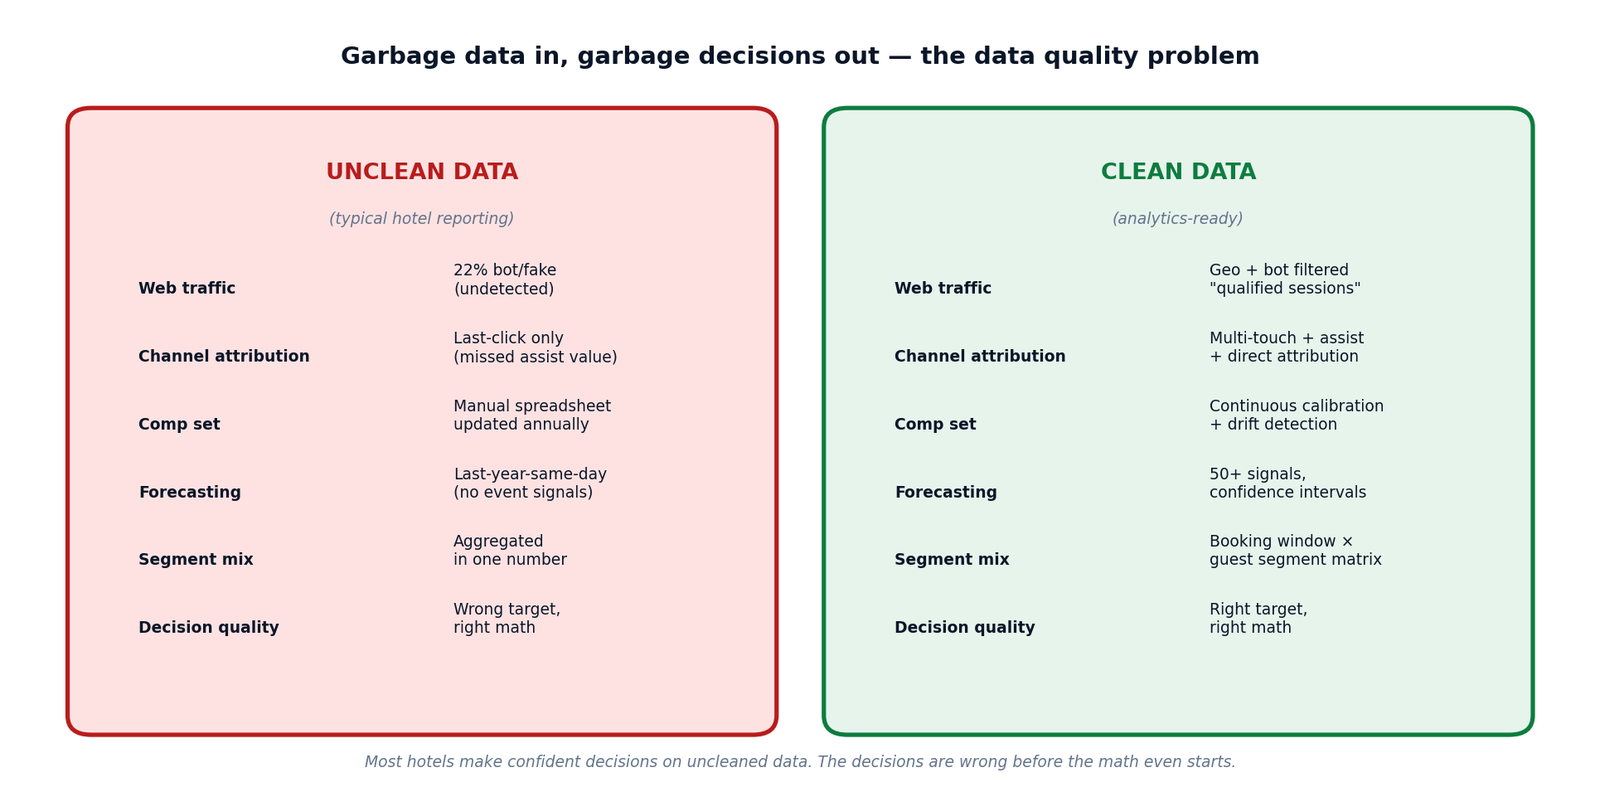
The 6 most common data quality problems
1. Bot and fake web traffic. A typical hotel website has 18–25% bot traffic that gets reported as "visitors" in GA4. Geographic anomalies, zero-time-on-page sessions, and datacenter IP signatures are all warning flags. The fix: filter by qualified sessions (geographic relevance + 10-second minimum + 1+ pages viewed).
2. Last-click attribution as the only model. Most hotels report bookings as "direct" when the guest’s actual journey was: saw a Google Ad → visited the site → left → came back via Booking.com search → went back to direct site → booked. Last-click credits the direct site. Multi-touch credits the Google Ad as the discovery touch. The two reports tell opposite stories about marketing ROI.
3. Comp set drift. A comp set selected 18 months ago is almost certainly wrong today. Properties reposition, change ADR bands, close, or open. Without quarterly calibration, the rate-shopping tool produces correct math against the wrong benchmark.
4. Last-year-same-day forecasting. Using LY-same-day as the primary forecast input ignores events that didn’t exist last year, comp set changes, market mix shifts, and macro signals. A LY-only forecast is wrong by 10–15% at 14 days out and worse beyond. See the predictive pricing guide.
5. Aggregated segment mix. Reporting "60% occupancy on pace" without breaking it down by segment and booking window averages signals that should be opposite. The right pricing decision is opposite for corporate (price-insensitive, last-minute) vs leisure (price-sensitive, advance-purchase).
6. Manual reconciliation across systems. When PMS occupancy, channel manager bookings, and OTA confirmations don’t agree by ~2–5%, the revenue manager’s Tuesday morning is spent reconciling — not deciding. This is operational tax that compounds across the year.
Decision quality scales with data quality — not with dashboard sophistication. A property with clean data and a simple dashboard outperforms a property with complex BI tools fed by uncleaned data. The discipline is data hygiene first, visualization second.
The Metric Hierarchy — Which Numbers Drive Which Decisions
Most hotels track too many metrics with the wrong cadence. The fix is to organize the 12 most decision-critical metrics into a 4-tier hierarchy by review cadence — so the right team member sees the right metric at the right time.
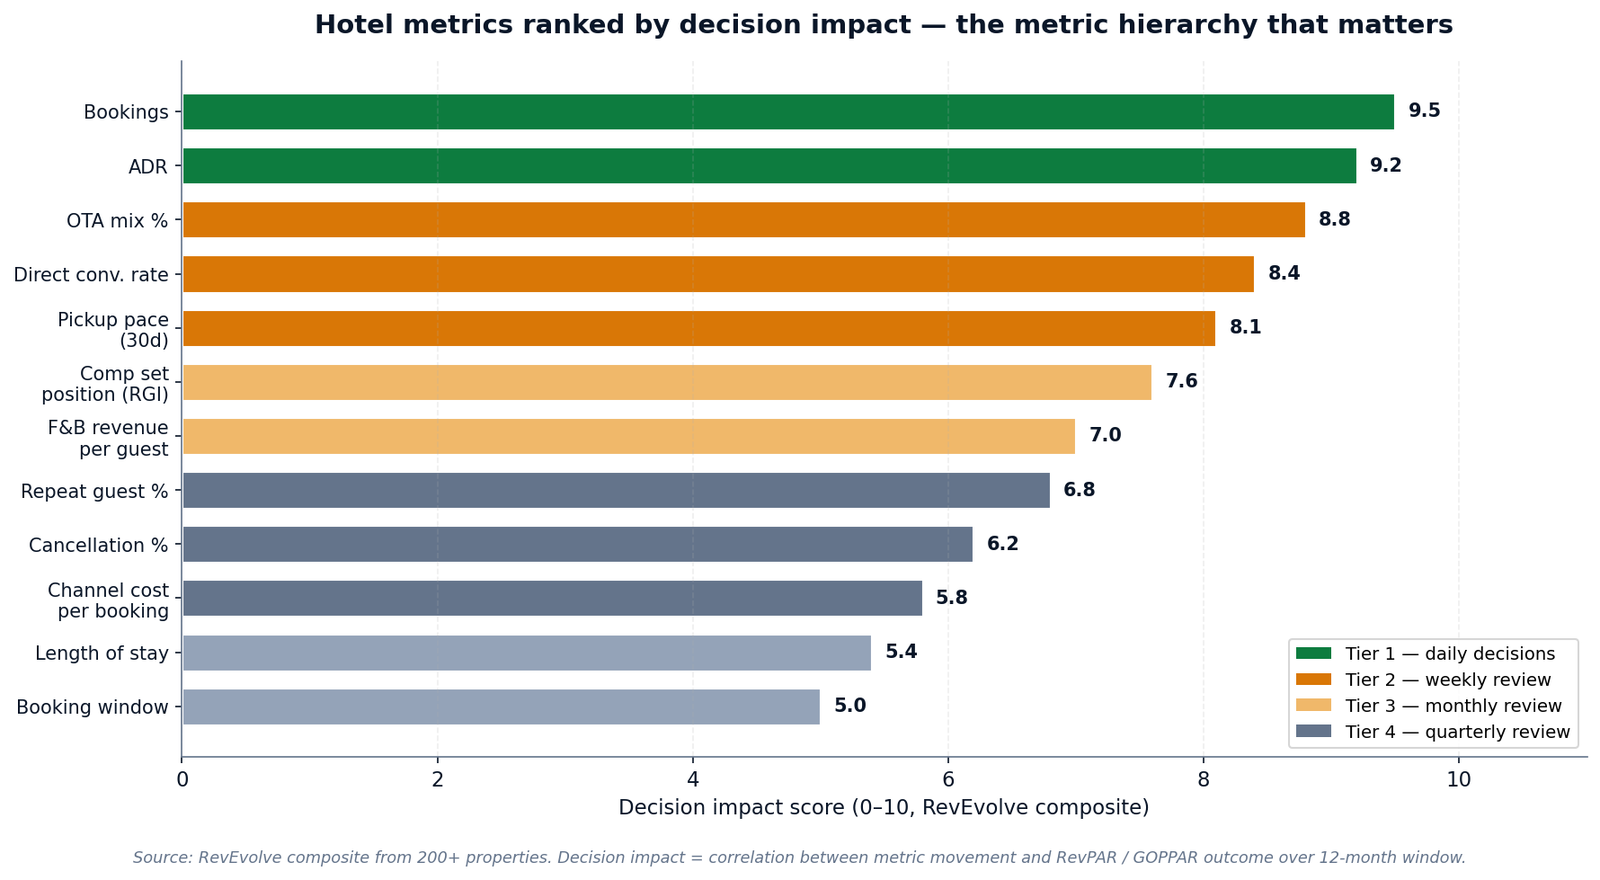
Tier 1 — Daily decisions (5 metrics)
| Metric | What it answers | Source |
|---|---|---|
| Bookings (today, this week) | Are we on pace? | PMS + channel manager |
| ADR (rolling 7d, MTD) | Are we capturing rate? | PMS |
| OTA mix % | Are we over-paying commission? | Channel manager + booking engine |
| Direct conversion rate | Is the booking engine working? | Booking engine + GA4 (filtered) |
| Pickup pace (next 30d) | Where is demand vs forecast? | PMS + RMS |
Tier 2 — Weekly review (2 metrics)
| Metric | What it answers | Source |
|---|---|---|
| Comp set position (RGI) | Are we under/over indexed vs comp set? | Rate-shopping tool |
| F&B revenue per occupied room | Is ancillary working? | POS + PMS |
Tier 3 — Monthly review (3 metrics)
| Metric | What it answers | Source |
|---|---|---|
| Repeat guest % | Is loyalty working? | CRM + PMS |
| Cancellation rate | Are rate fences correct? | PMS + booking engine |
| Channel cost per booking (CPA) | Is each channel profitable? | Channel manager + accounting |
Tier 4 — Quarterly review (2 metrics)
| Metric | What it answers | Source |
|---|---|---|
| Length of stay distribution | Are LOS rules working? | PMS |
| Booking window distribution | Is forecast horizon accurate? | PMS + RMS |
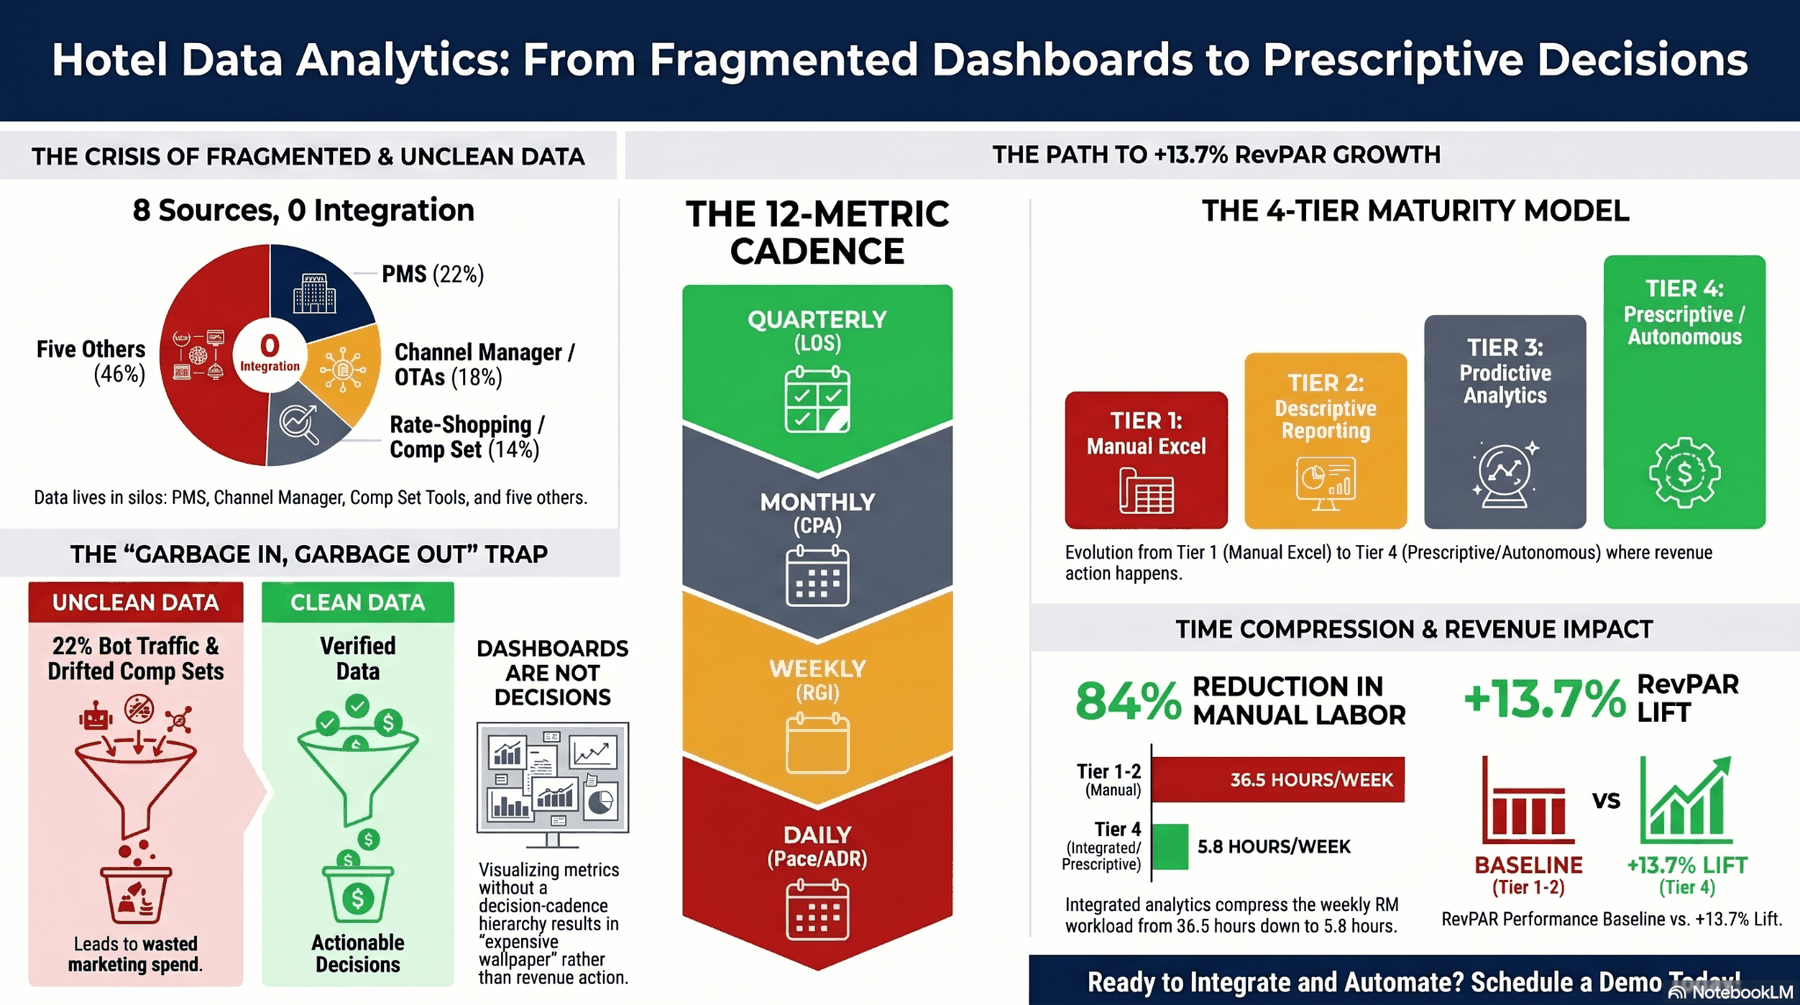
The 4-Tier Hotel Analytics Maturity Model
Where does your property sit on the analytics maturity curve? The 4-tier model is the simplest diagnostic.
| Tier | Question it answers | Tools | Weekly RM time |
|---|---|---|---|
| Tier 1 — Descriptive | What happened? | Excel reports, manual exports | ~12 hrs/week |
| Tier 2 — Diagnostic | Why did it happen? | BI dashboards, integrated PMS + channel manager + GA4 | ~6 hrs/week |
| Tier 3 — Predictive | What will happen? | ML demand forecast, pricing recommendations | ~2 hrs/week |
| Tier 4 — Prescriptive | What should we do? | Autonomous decisions, human approves strategy | ~30 min/week |
Where most properties sit today
- Independent hotels under 30 rooms: mostly Tier 1 (Excel reports). Manual reporting takes ~10–15 hours/week of GM or owner time.
- Independent hotels 30–100 rooms: Tier 1–2. Most have a basic BI dashboard but spend significant time on manual reconciliation.
- Independent hotels 100+ rooms: Tier 2–3. Typically have a real RMS with predictive forecasting; some have started Tier 4 pilots.
- Branded full-service hotels: Tier 2–3, with brand-level Tier 4 systems on the roadmap.
- Multi-property RM companies: the leading edge in 2026 is Tier 4 with autonomous execution.
What Tier 4 Looks Like in Practice — Decision Time Compression
The most measurable benefit of moving up the analytics maturity tiers is time. A revenue manager at Tier 1–2 spends ~36 hours per week on data compilation, reconciliation, and report production. A revenue manager at Tier 3–4 spends ~6 hours per week on those same activities — and the rest on strategic work.
| Activity | Tier 1–2 (manual) | Tier 3–4 (integrated) | Time saved |
|---|---|---|---|
| Daily pricing update | 3.5 hrs/wk | 0.5 hrs/wk | 85% |
| Comp set review | 8 hrs/wk | 1.2 hrs/wk | 85% |
| Channel mix adjustment | 6 hrs/wk | 1.5 hrs/wk | 75% |
| Forecast revision | 5 hrs/wk | 0.8 hrs/wk | 84% |
| Owner report preparation | 14 hrs/wk | 1.8 hrs/wk | 87% |
| Total weekly time | 36.5 hrs/wk | 5.8 hrs/wk | 84% |
Currently spending probably 8–10 hours weekly on competitive analysis and pricing decisions and we need something that automates at least part of this because I don’t want to put that much time on it.
What gets done with the saved 30 hours per week
- Strategic projects: new revenue lines, segment expansion, brand positioning work
- Owner conversations: deeper monthly reviews with quantified GOPPAR attribution
- Team coaching: training front office and sales teams on revenue optimization basics
- Cross-property work: for multi-property operators, the saved time enables 2×–3× property-per-RM ratios
- Continuous improvement: testing new strategies, refining guardrails, calibrating models
5 Common Mistakes Hotels Make With Data Analytics
Mistake 1 — Investing in dashboards before fixing data quality
A hotel with unclean data and a $10k BI tool produces beautiful, fast, completely wrong reports. Bot traffic stays in the conversion math. Last-click attribution stays in the ROI math. Comp set drift stays in the pricing math. The dashboard is excellent at the wrong target.
Mistake 2 — Tracking 47 metrics with the same review cadence
Most properties have a "weekly metrics review" that includes both daily-decision metrics (pickup pace) and quarterly-strategic metrics (length of stay distribution). This guarantees that operationally urgent items get buried and strategic items get noise.
Mistake 3 — Mistaking integration for analytics
Connecting your PMS to your channel manager produces integrated data, not analytics. Analytics is what you do with the integrated data — the questions you ask, the comparisons you run, the decisions you trigger. Integration is a precondition for analytics, not a substitute.
Mistake 4 — Reporting RevPAR without GOPPAR context
Most properties report RevPAR monthly. RevPAR up 4% can hide GOPPAR down 2% — because OTA mix grew, commission grew, or labor cost grew faster. Owners reading RevPAR-only reports get a false positive on commercial performance.
Mistake 5 — Stopping at predictive without moving to prescriptive
Tier 3 (predictive) shows you a forecast and a pricing recommendation. Tier 4 (prescriptive) executes the recommendation. The gap between Tier 3 and Tier 4 is where most of the lift lives — because forecast accuracy and decision velocity compound only when there is no human latency between them.
Conclusion — The Goal Is Decisions, Not Dashboards
Hotel data analytics in 2026 is not a tooling problem. Most properties already have all 8 data sources. The problem is that the data is fragmented, unclean, mis-tiered, and disconnected from action. Closing those four gaps — in that order — is the entire discipline.
Properties that move from Tier 1–2 to Tier 4 see two compounding outcomes: an 84% reduction in weekly revenue manager time, and a +9–13% RevPAR lift through better-targeted decisions on cleaner data. The combination redeploys human capacity to strategy and lets the data drive the tactics. That is what data analytics for hotels should mean in 2026.
I’m working on an intelligence layer turning fragmented data sources (PMS/STR/CRS/POS, etc.) to real insight for management decisions as well as automating the reporting process for revenue managers. Phase 1: real-time profit/performance insights, detecting revenue leakage, automating reporting.
Stop building dashboards. Start building decisions.
- → See RevEvolve’s Portfolio Dashboard in action — 8 data sources unified, cleaned, organized by decision tier, and connected to autonomous execution. RevPAR + TRevPAR + GOPPAR in a single operator-facing view. 15-minute walkthrough.
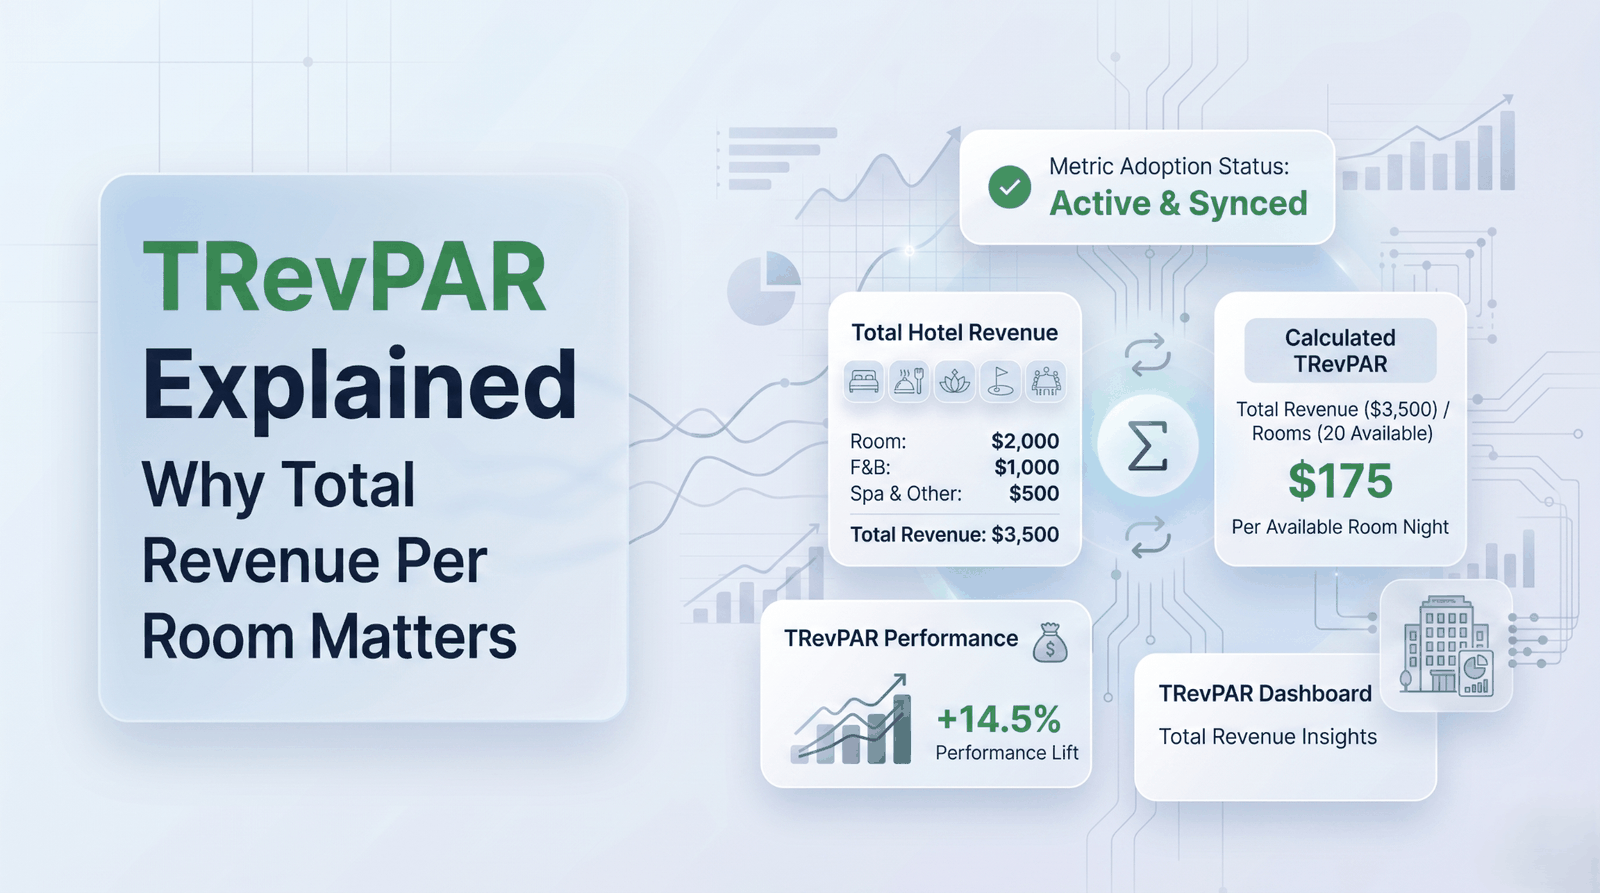
- → Read the TRevPAR guide — the total-revenue metric that RevPAR-only reporting hides.