QUICK ANSWER — Hotel distribution channels are the routes through which a property sells its rooms — split into direct (your website, booking engine, phone, walk-in, loyalty) and indirect (OTAs, metasearch, GDS, wholesalers, tour operators). Each carries a different acquisition cost, typically ranging from under 10% for repeat direct guests to 25–30% for wholesale. A channel mix protects margin when it is built on net contribution per channel, not booking volume.
Two bookings land on the same Tuesday. Both show $200 on the reservation. One nets you $192, the other $140. Nothing about the room, the guest, or the night is different — only the channel they came through. Multiply that gap across a year and it is the difference between a property that funds its refurbishment and one that defers it.
Direct vs OTA is one decision inside a bigger question — we compared those two here. This guide covers the full channel portfolio and what each one costs you: the complete map, the net contribution math, the “direct is free” myth, and how to build a mix that fits your property rather than a benchmark someone else published.
Ownership wants 60% direct. We’re an independent boutique in a secondary market. Without the OTAs nobody would find us. That target isn’t a strategy, it’s a wish.
Key takeaways
- Judge channels on net contribution, not volume. A high-booking channel can be your least profitable one.
- Direct is not free. Once you count paid search, booking engine fees, loyalty and call centre, all-in direct cost often lands around 10–13%.
- There is no universal target mix. A “40–60% direct” benchmark that fits a resort can be unreachable for an independent boutique.
- OTAs buy visibility, not just bookings. The billboard effect means cutting them can reduce direct demand too.
- Cancellation rates differ by channel. A channel’s real value is net of the bookings that never arrive.
What Are Hotel Distribution Channels?
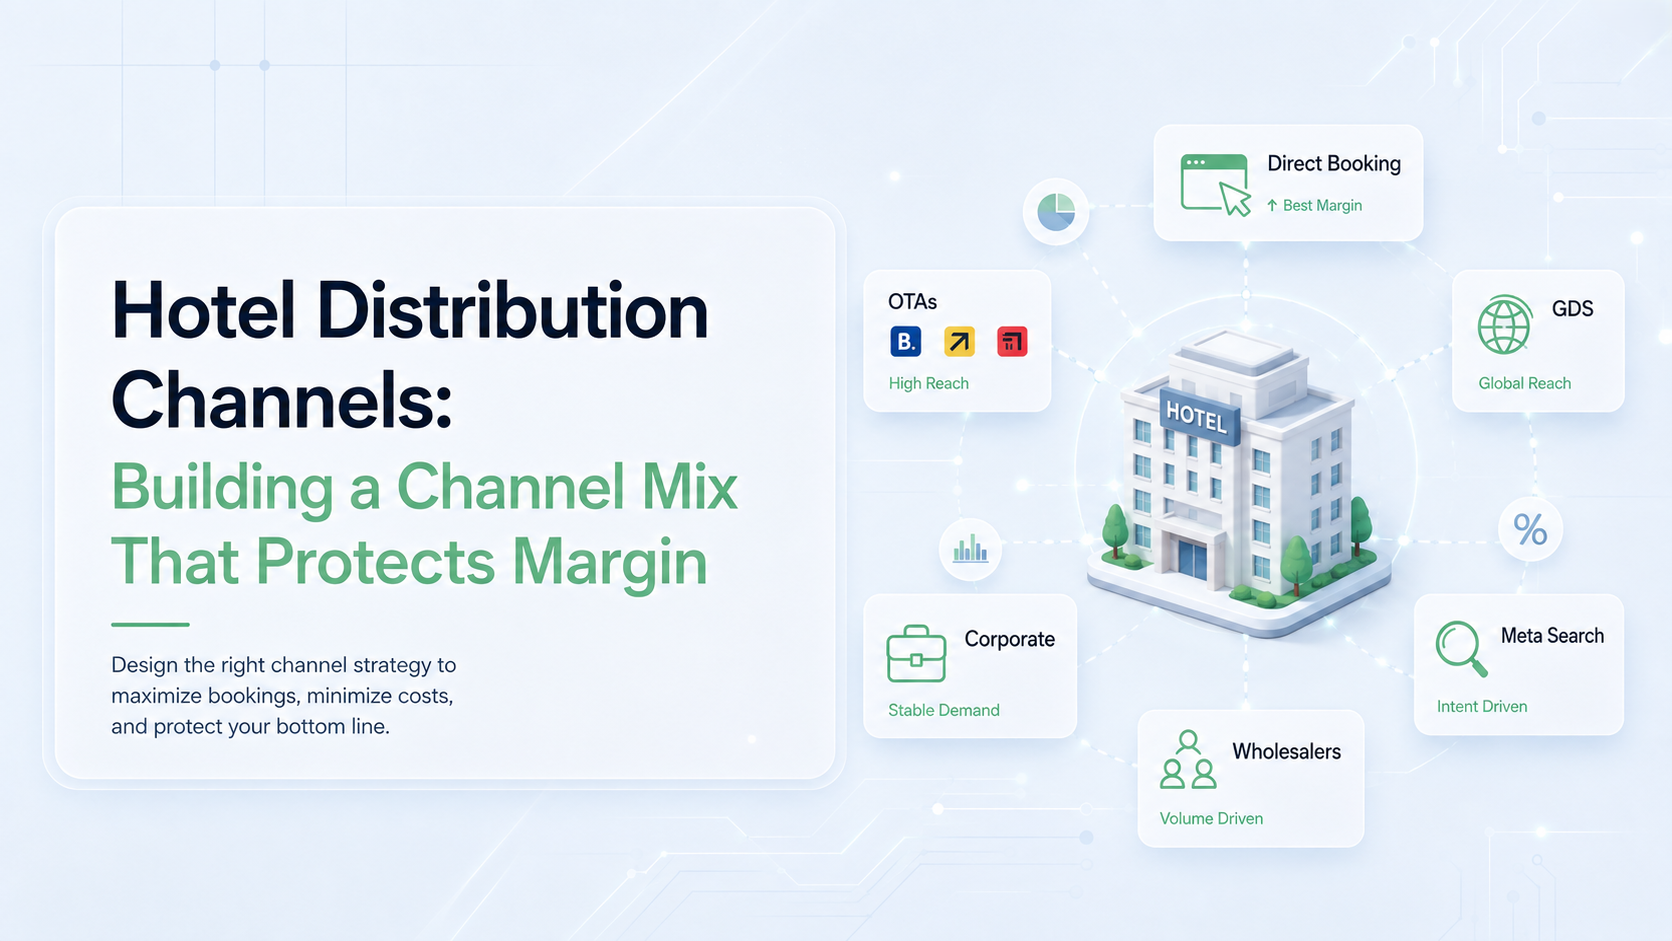
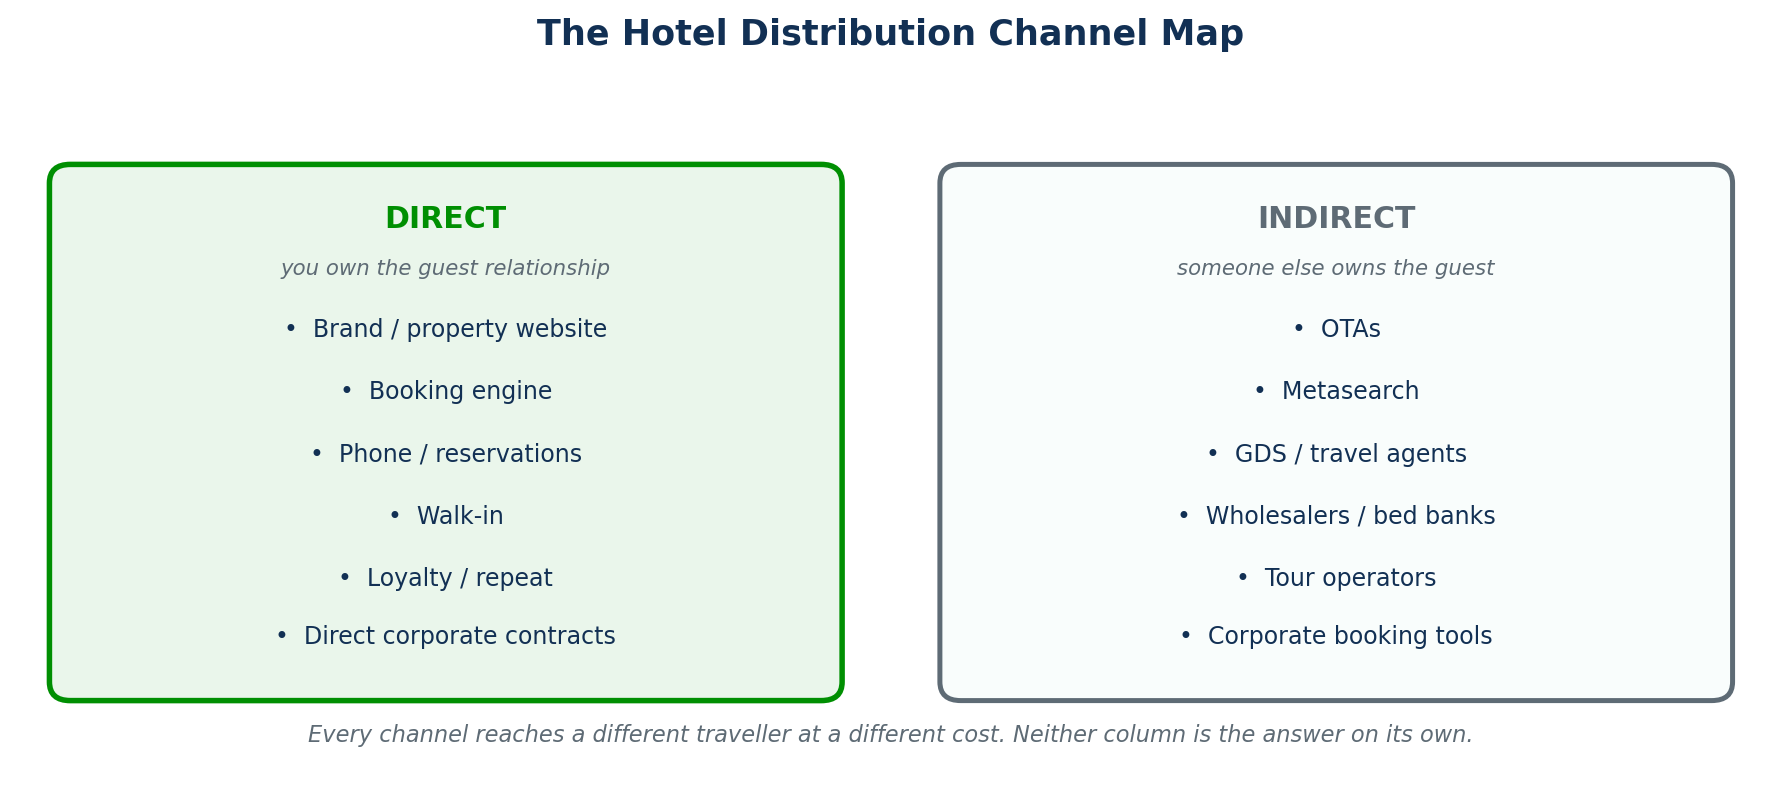
The distinction that matters is not online versus offline, or big versus small. It is who owns the guest. On a direct booking you hold the guest data, the communication, and the relationship for next time. On an indirect booking, someone else does — and they charge you for the introduction.
Direct channels
Your brand or property website, the booking engine behind it, phone reservations, walk-ins, loyalty redemptions, and directly negotiated corporate contracts. Lowest cost, highest control, smallest reach on their own.
Indirect channels
OTAs, metasearch, the GDS and traditional travel agents, wholesalers and bed banks, tour operators, and corporate booking tools. Higher cost, less control, and dramatically more reach than any independent property can generate alone.
The Only Comparison That Matters: Net Contribution per Channel
Most channel reporting stops at bookings and revenue. Both are gross numbers, and gross numbers make your most expensive channel look like your best one, because expensive channels are usually high volume.
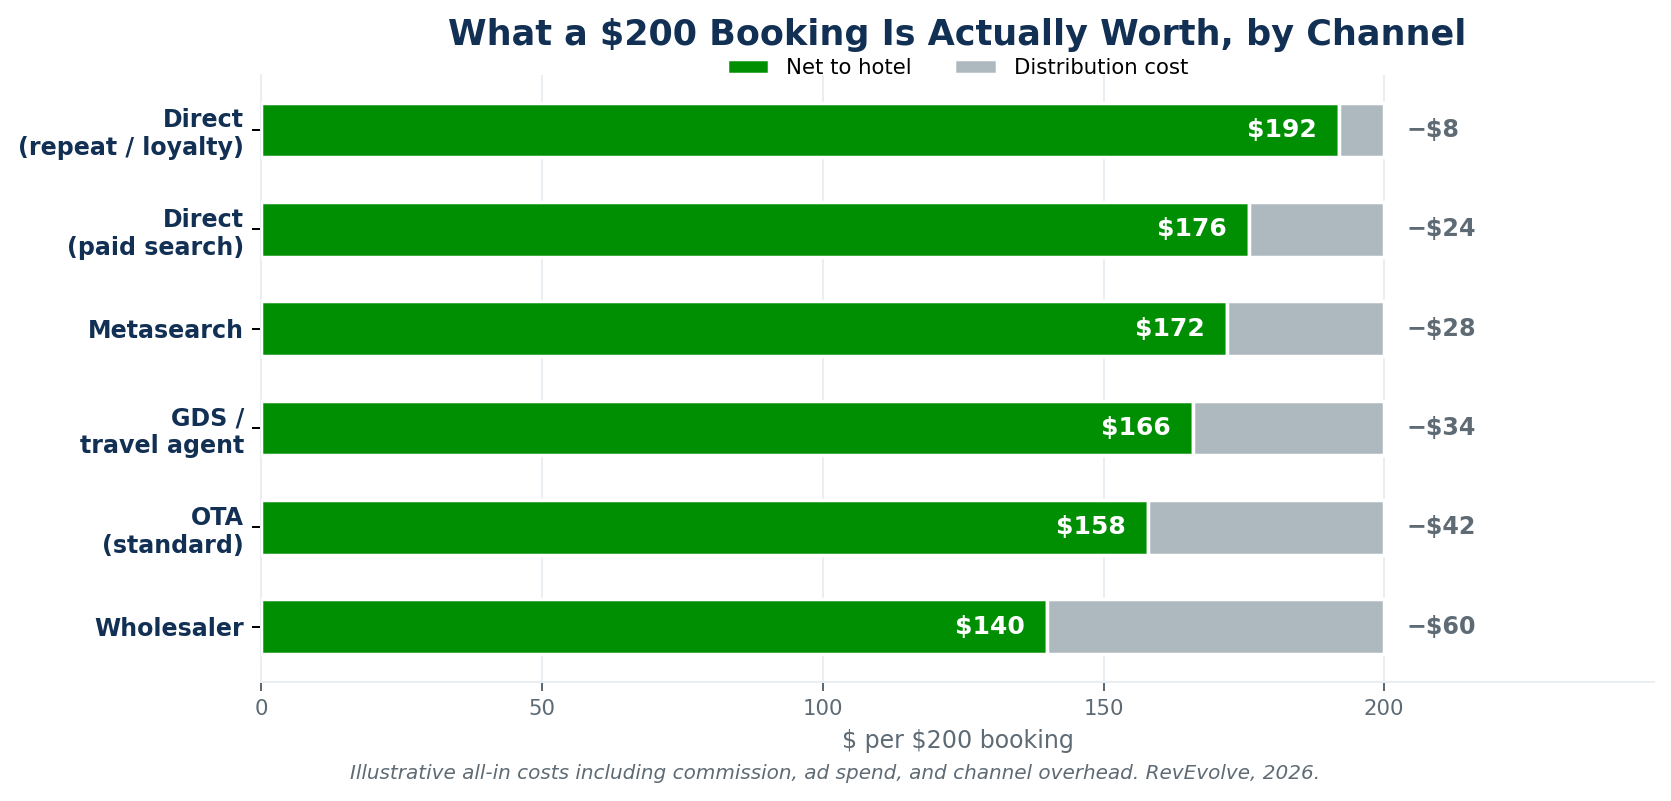
The number to manage is what actually reaches your P&L after the cost of acquiring that booking. Here is what a single $200 reservation is worth across six channels once the cost of getting it is subtracted.
| Channel | Typical all-in cost | Net on a $200 booking | What you are buying |
|---|---|---|---|
| Direct — repeat / loyalty | ~4% | $192 | A relationship you already paid for |
| Direct — paid search | ~12% | $176 | Intent you had to bid for |
| Metasearch | ~14% | $172 | Comparison-shopper capture |
| GDS / travel agent | ~17% | $166 | Corporate and agency demand |
| OTA — standard | ~21% | $158 | Reach and discovery |
| Wholesaler / bed bank | ~30% | $140 | Volume and distressed-date cover |
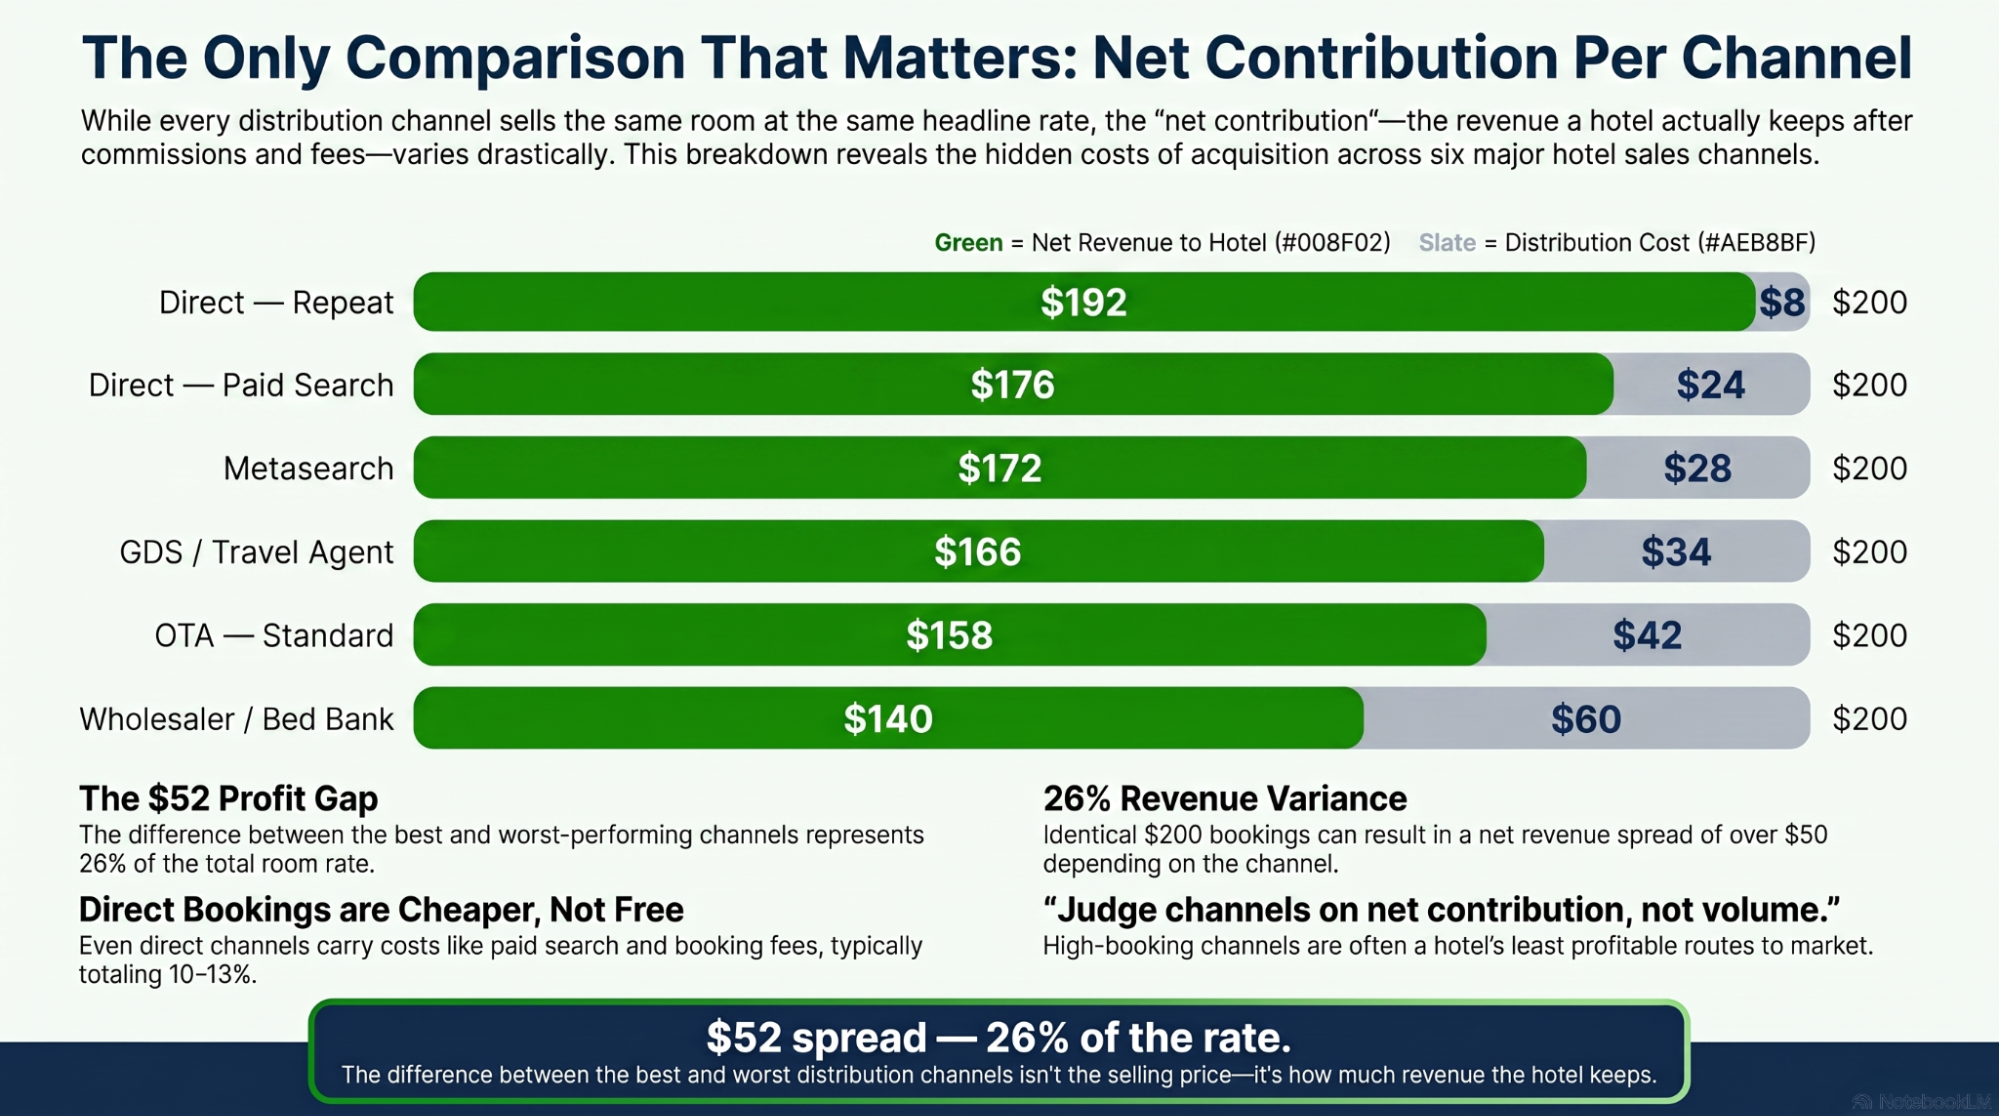
Two things fall out of this table that a volume report will never show you. First, the spread between your cheapest and most expensive channel is roughly $52 on a $200 booking — 26% of the rate. Second, the ranking is not simply “direct good, OTA bad.” A direct booking bought through aggressive paid search costs more than a metasearch booking, and both cost more than a repeat guest walking straight to your site.
The “Direct Is Free” Myth
Almost every distribution article treats direct as the costless ideal and indirect as the expensive compromise. Direct is genuinely cheaper. It is not free, and the gap is narrower than the framing suggests.
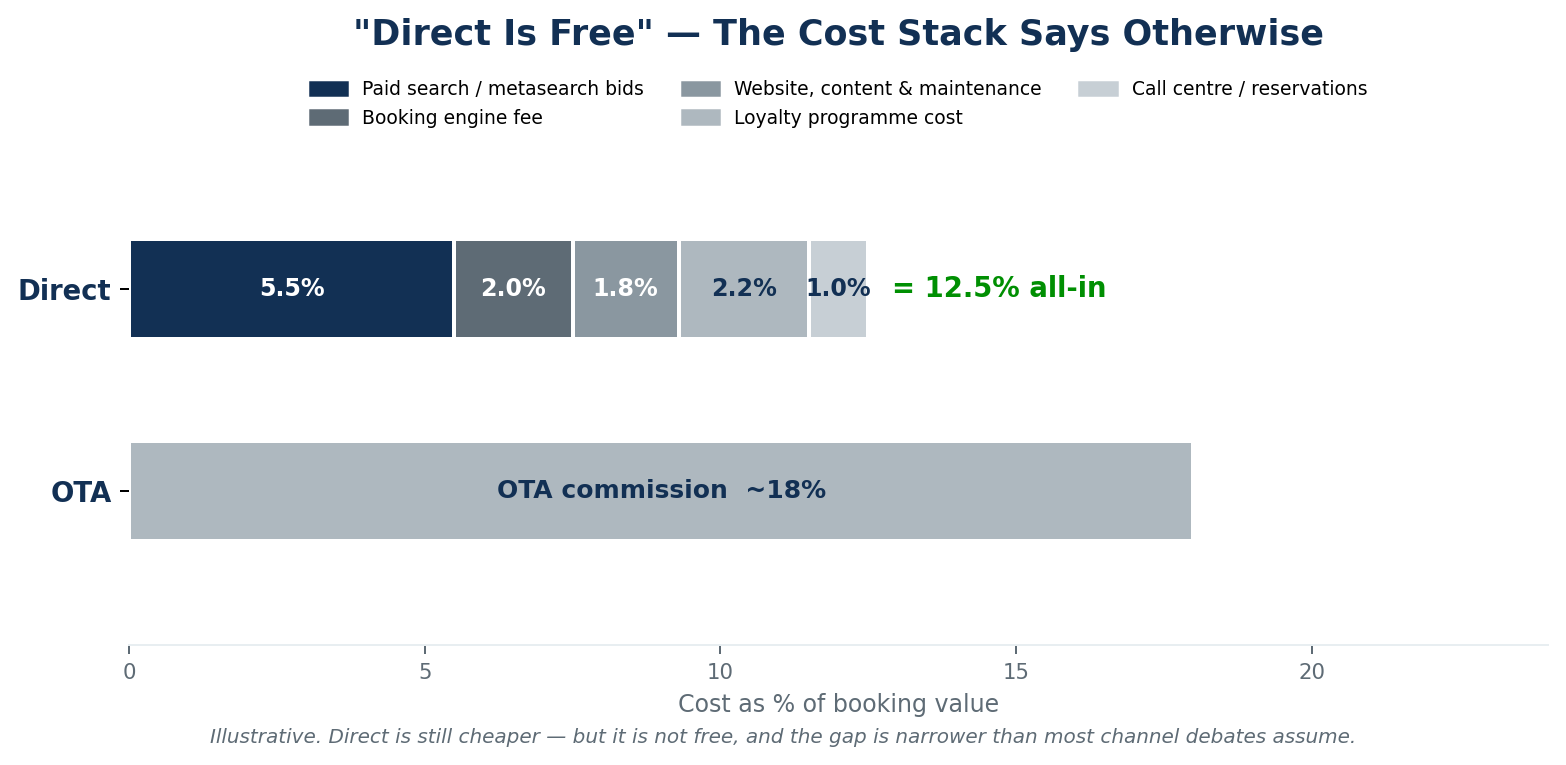
A direct booking carries real costs that rarely appear in channel reporting because they sit in different budget lines. Paid search and metasearch bids to capture the traveller before an OTA does. The booking engine fee. Website build, content, and maintenance. Loyalty programme cost. Call centre and reservations staff. Add them up and all-in direct acquisition frequently lands around 10–13% of booking value — against an OTA commission commonly in the 15–25% range.
That is still a meaningful advantage and worth pursuing. But “shift everything to direct” stops being obviously correct once you price it, because the marginal direct booking is the expensive one. The first 20% of your direct business is cheap: repeat guests, brand searches, people who already decided. The next 20% is bought through competitive bidding against OTAs on the same keywords, and it can cost nearly as much as the commission it replaced.
The Billboard Effect: Why Pure Cost Analysis Misleads
If you evaluate channels only on net contribution per booking, the logical conclusion is to cut the expensive ones. Properties that act on that conclusion often find direct bookings falling too, which surprises them.
The reason is that OTAs are not only a booking channel; they are a discovery channel. Travellers browse OTAs to find and compare properties, then a meaningful share leave and book direct — the long-observed billboard effect. Some of your direct business exists because of your OTA visibility, and the reporting attributes none of it there.
This is also where rate parity becomes strategy rather than compliance. If a traveller finds you on an OTA and your direct rate is higher, you have paid for the discovery and lost the booking. If the direct rate is meaningfully better, you capture the guest at a lower cost — but risk your OTA ranking. The line between the two is a decision, not a rule.
The practical takeaway is that channels do not operate independently, and a mix decision made channel-by-channel in isolation will overcorrect. Reduce OTA dependency gradually and watch what happens to direct volume before cutting further.
There Is No Universal Channel Mix
Published benchmarks are the most misused numbers in distribution. “Aim for 40–60% direct” gets quoted as though it applies to every property, and it does not.
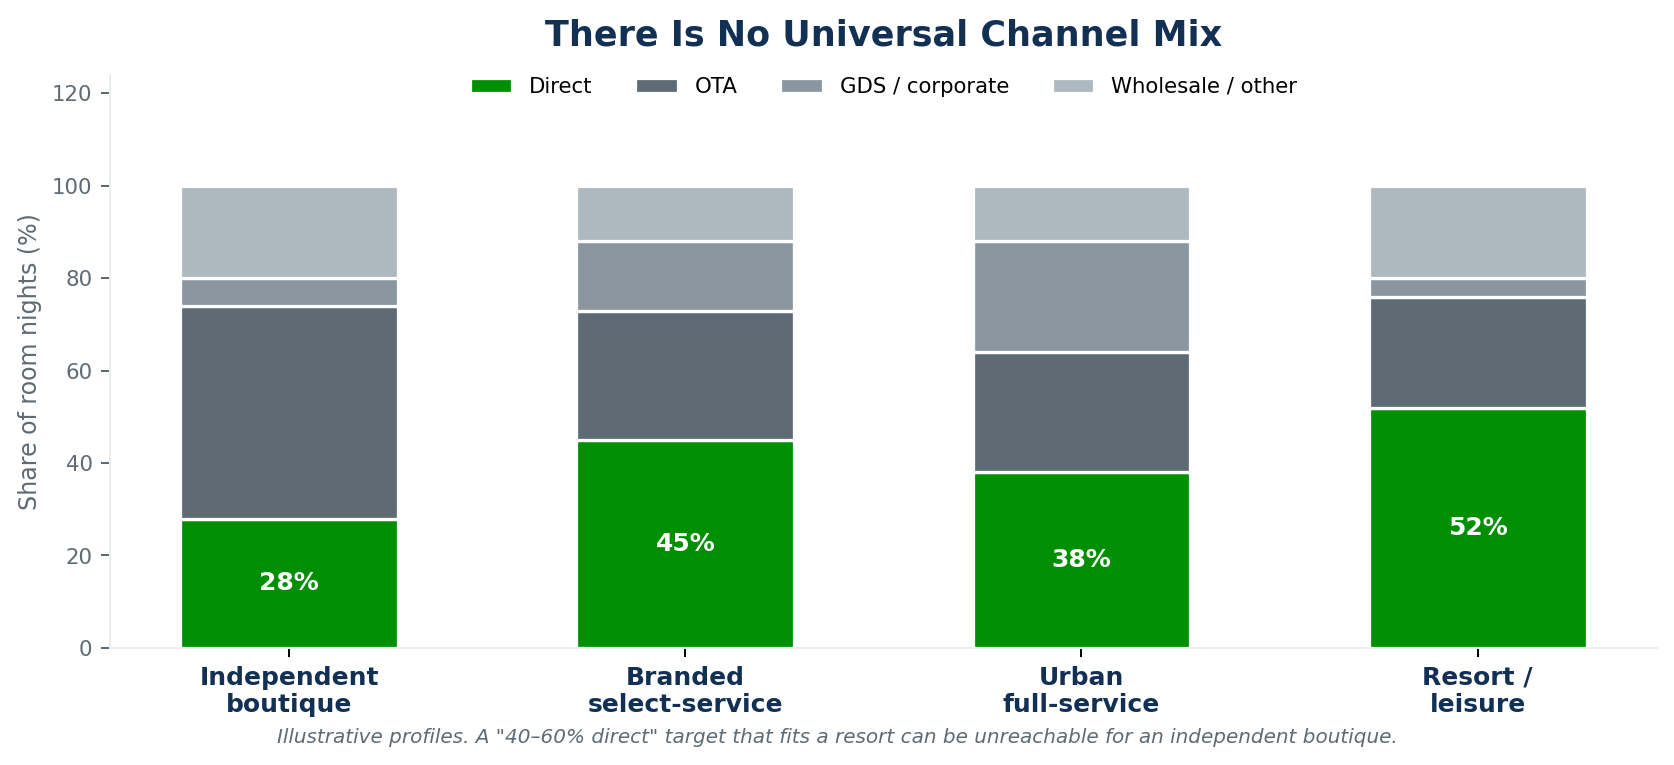
An independent boutique in a secondary market depends on OTA visibility to be found at all; a 28% direct share may be a genuinely strong result. A branded select-service hotel inherits brand-site traffic and a loyalty base, so 45% is unremarkable. An urban full-service property leans on GDS and corporate volume that a resort has no access to. A leisure resort with a repeat guest base and long booking windows can push past 50% direct without buying it.
Setting the same target across a mixed portfolio guarantees that some properties are chasing an impossible number while others are underachieving against one that is too easy. The target should be derived from the property’s segment mix, market position, and brand strength — not copied from an article.
How to set a realistic target
Start from where you are and what each channel actually costs you. Model what a five-point shift would require in incremental spend, and what it would save in commission. If the spend exceeds the saving, the current mix is closer to optimal than the benchmark suggests. Then set the target on net contribution, not on direct share — because direct share is a proxy, and proxies get gamed.
The Variable Nobody Puts in the Model: Cancellations
Channel cost analysis almost always runs on booked revenue. Guests who cancel never arrive, and cancellation behaviour is not evenly distributed across channels.
Free-cancellation OTA rates and speculative bookings cancel at materially higher rates than advance-purchase direct or contracted corporate business. A channel delivering a high volume of bookings that convert to stays at a lower rate is worth less than its booking count implies — and the cost of holding that inventory, potentially turning away firmer demand, does not appear anywhere in a commission calculation.
The fix is straightforward and rarely done: run your channel contribution analysis on realised room nights rather than bookings. Take gross revenue from stays that actually happened, subtract the acquisition cost, and compare. Channels reorder more often than people expect.
How to Build a Channel Mix That Protects Margin
Six steps, in the order that stops you from optimising the wrong thing.
- Get the true cost of every channel on one page. Pull 12 to 24 months of bookings, revenue, and every associated cost — commissions, ad spend, engine fees, loyalty, staff. Most properties have never seen these in one view because the costs live in different budgets.
- Recalculate on realised stays, not bookings. Strip out cancellations and no-shows per channel. This is the step that changes the ranking.
- Map channels to segments, not to preference. Corporate travellers book through GDS and booking tools. Comparison shoppers arrive via metasearch. You cannot shift a segment to a channel it does not use, and trying is how properties lose the segment entirely.
- Vary the mix by date, not just by year. On compression dates you need no help selling rooms — that is when to restrict the expensive channels and protect rate. On soft shoulder dates, wholesale and OTA volume is worth its cost.
- Reduce dependency gradually and watch the second-order effect. Cut expensive channels in increments and measure what happens to total demand, not just to that channel. The billboard effect makes step changes risky.
- Report net, permanently. If leadership sees gross channel revenue every month, gross is what gets managed. Change the report and the conversation changes with it.
Where the Channel Decision Meets the Pricing Decision
Channel mix and pricing get managed as separate disciplines, usually by overlapping people using different reports. They are the same decision viewed from two angles: what to charge, and where to sell it.
The date-level version is where the money is. On a compression night, restricting wholesale and holding rate protects margin twice over. On a soft Tuesday eight weeks out, the same restriction leaves rooms empty. Knowing which is which requires a forward view of demand rather than a backward view of channel performance — which is what RM Copilot provides: it analyzes demand and pace across your PMS data, recommends the pricing action with the reasoning attached, and lets your team simulate the projected impact before committing. Your team reviews and applies the decision.
The mechanics of getting that rate to your channels sit elsewhere — that is your channel manager, which distributes whatever it is given. The revenue layer decides the number; the distribution layer moves it. Confusing the two is how properties end up with excellent connectivity and mediocre margin.
Worth separating two categories people conflate: some hospitality AI is guest-facing — chat and messaging that help you talk to travelers. RM Copilot is operator-facing, working with your revenue team on the pricing decision itself.
Questions From the Commercial Meeting
Keep going: Direct bookings vs OTAs · Hotel rate parity explained · Maximizing online revenue with e-commerce strategies.