QUICK ANSWER — Hotel occupancy rate is the percentage of your available rooms that were sold in a given period. The formula is Occupancy = (Rooms Sold ÷ Rooms Available) × 100. A 120-room hotel that sells 90 rooms runs 75% occupancy. For 2026, CoStar and Tourism Economics project U.S. hotel occupancy around 62.1% — well below the 70–95% range many guides cite as “good.”
Somebody sends the Monday email: “We hit 96% Saturday night — great work.” And it might have been. Or you sold the last twenty rooms on Thursday at $180 to guests who would have paid $260 on Saturday morning, and the 96% is a receipt for money you left behind.
Occupancy is the first metric anyone in a hotel learns and the one most likely to be read as a scoreboard when it is really a diagnostic. This guide covers the formula, the denominator question that quietly changes your number, what U.S. occupancy actually runs in 2026 (it is not what most guides claim), and how to read occupancy against rate instead of in isolation.
Ownership wants 90% occupancy. I keep explaining that we’d have to give the rooms away to get there and RevPAR would fall. It doesn’t land.
Key takeaways
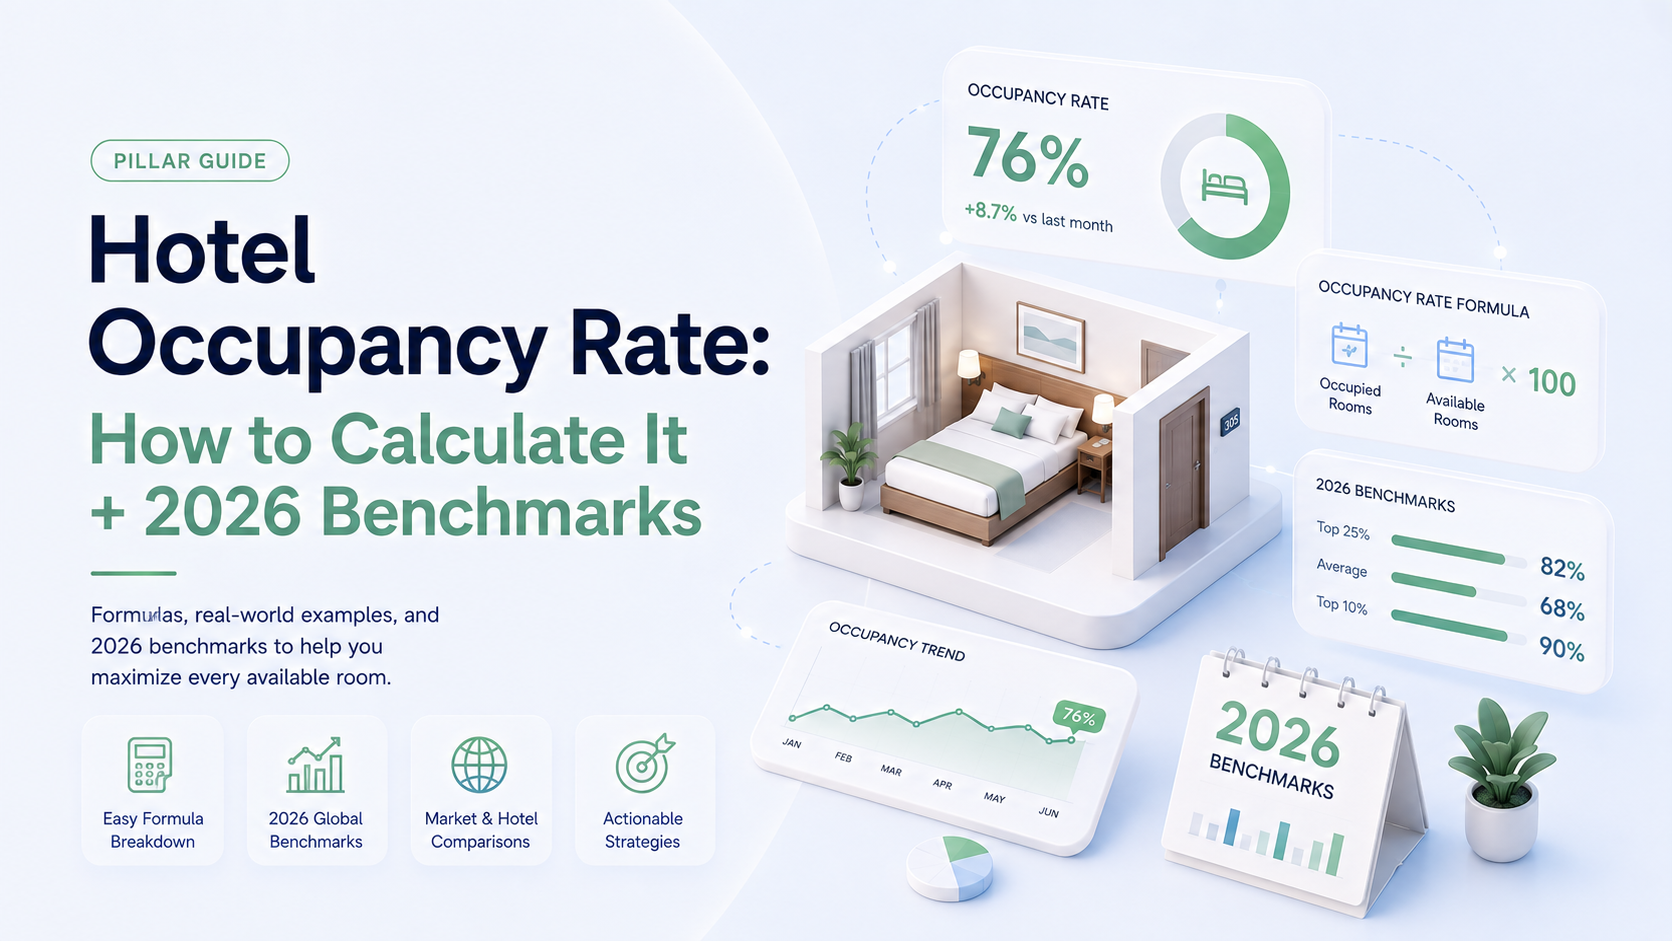
- Occupancy = (Rooms Sold ÷ Rooms Available) × 100. For a multi-night period, multiply the room count by the number of nights.
- The denominator decides the number. Out-of-order rooms usually stay in “rooms available” — pick one basis and never quietly switch it.
- U.S. occupancy is forecast near 62.1% for 2026, versus 65.8% pre-pandemic. The widely published “70–95% is good” figure does not match the data.
- Occupancy alone cannot tell you whether a night went well. Only RevPAR settles the occupancy-versus-rate argument.
- Selling out days before arrival is usually a pricing miss, not a win. If demand were fully priced, the last rooms would clear close to arrival.
What Is Hotel Occupancy Rate?
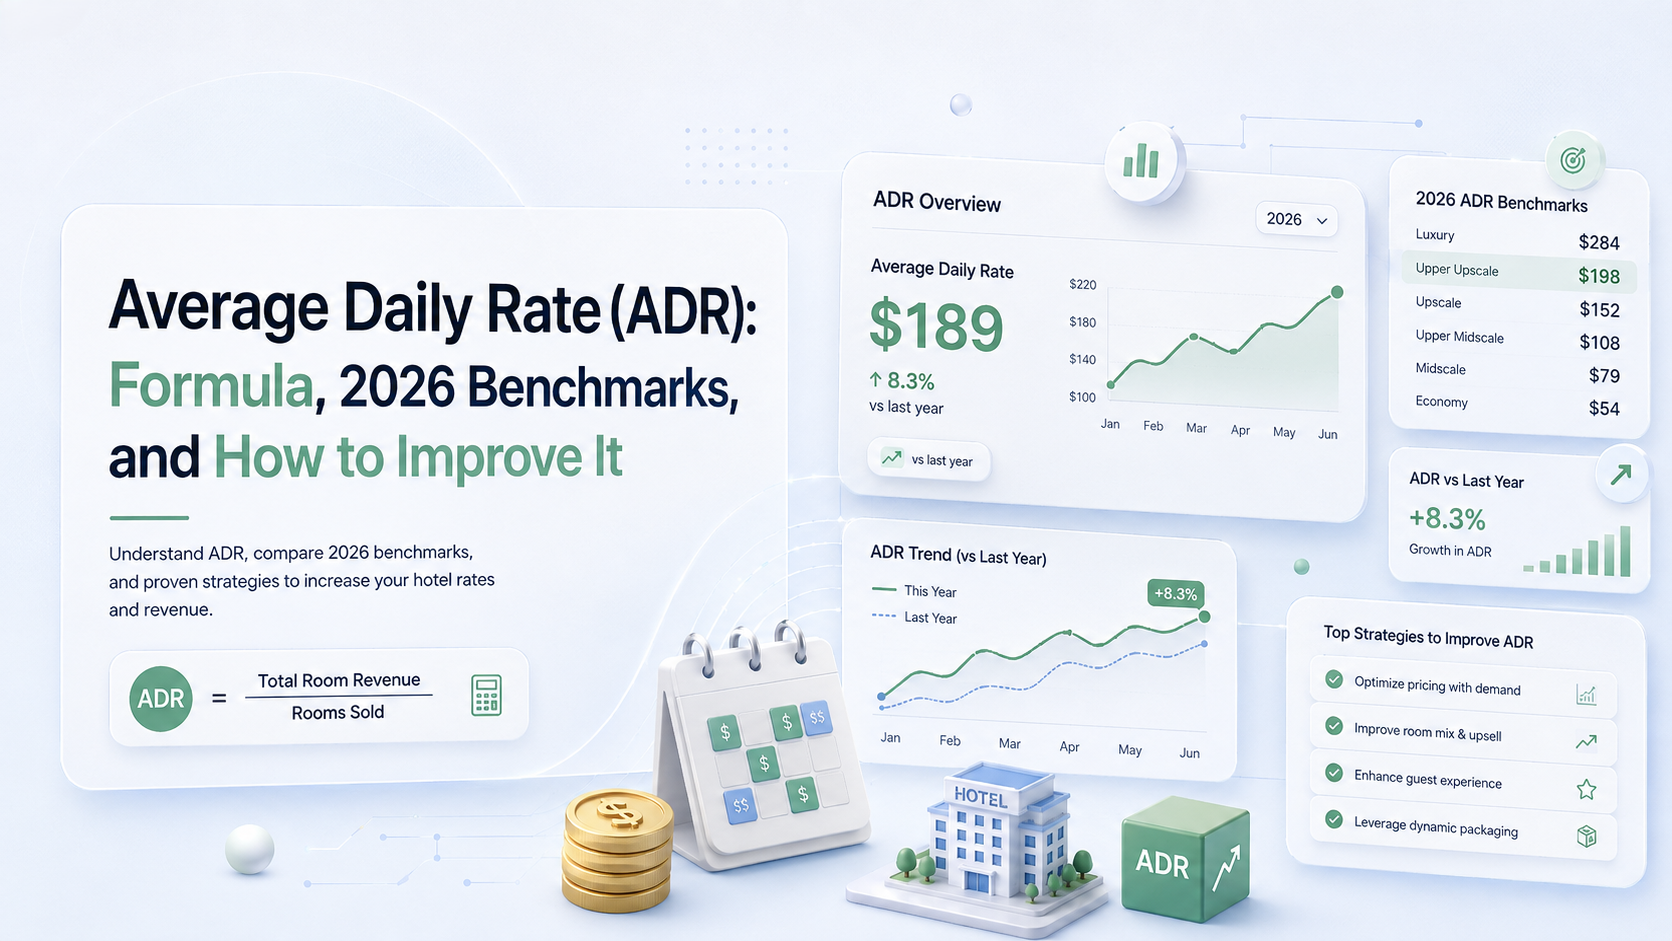
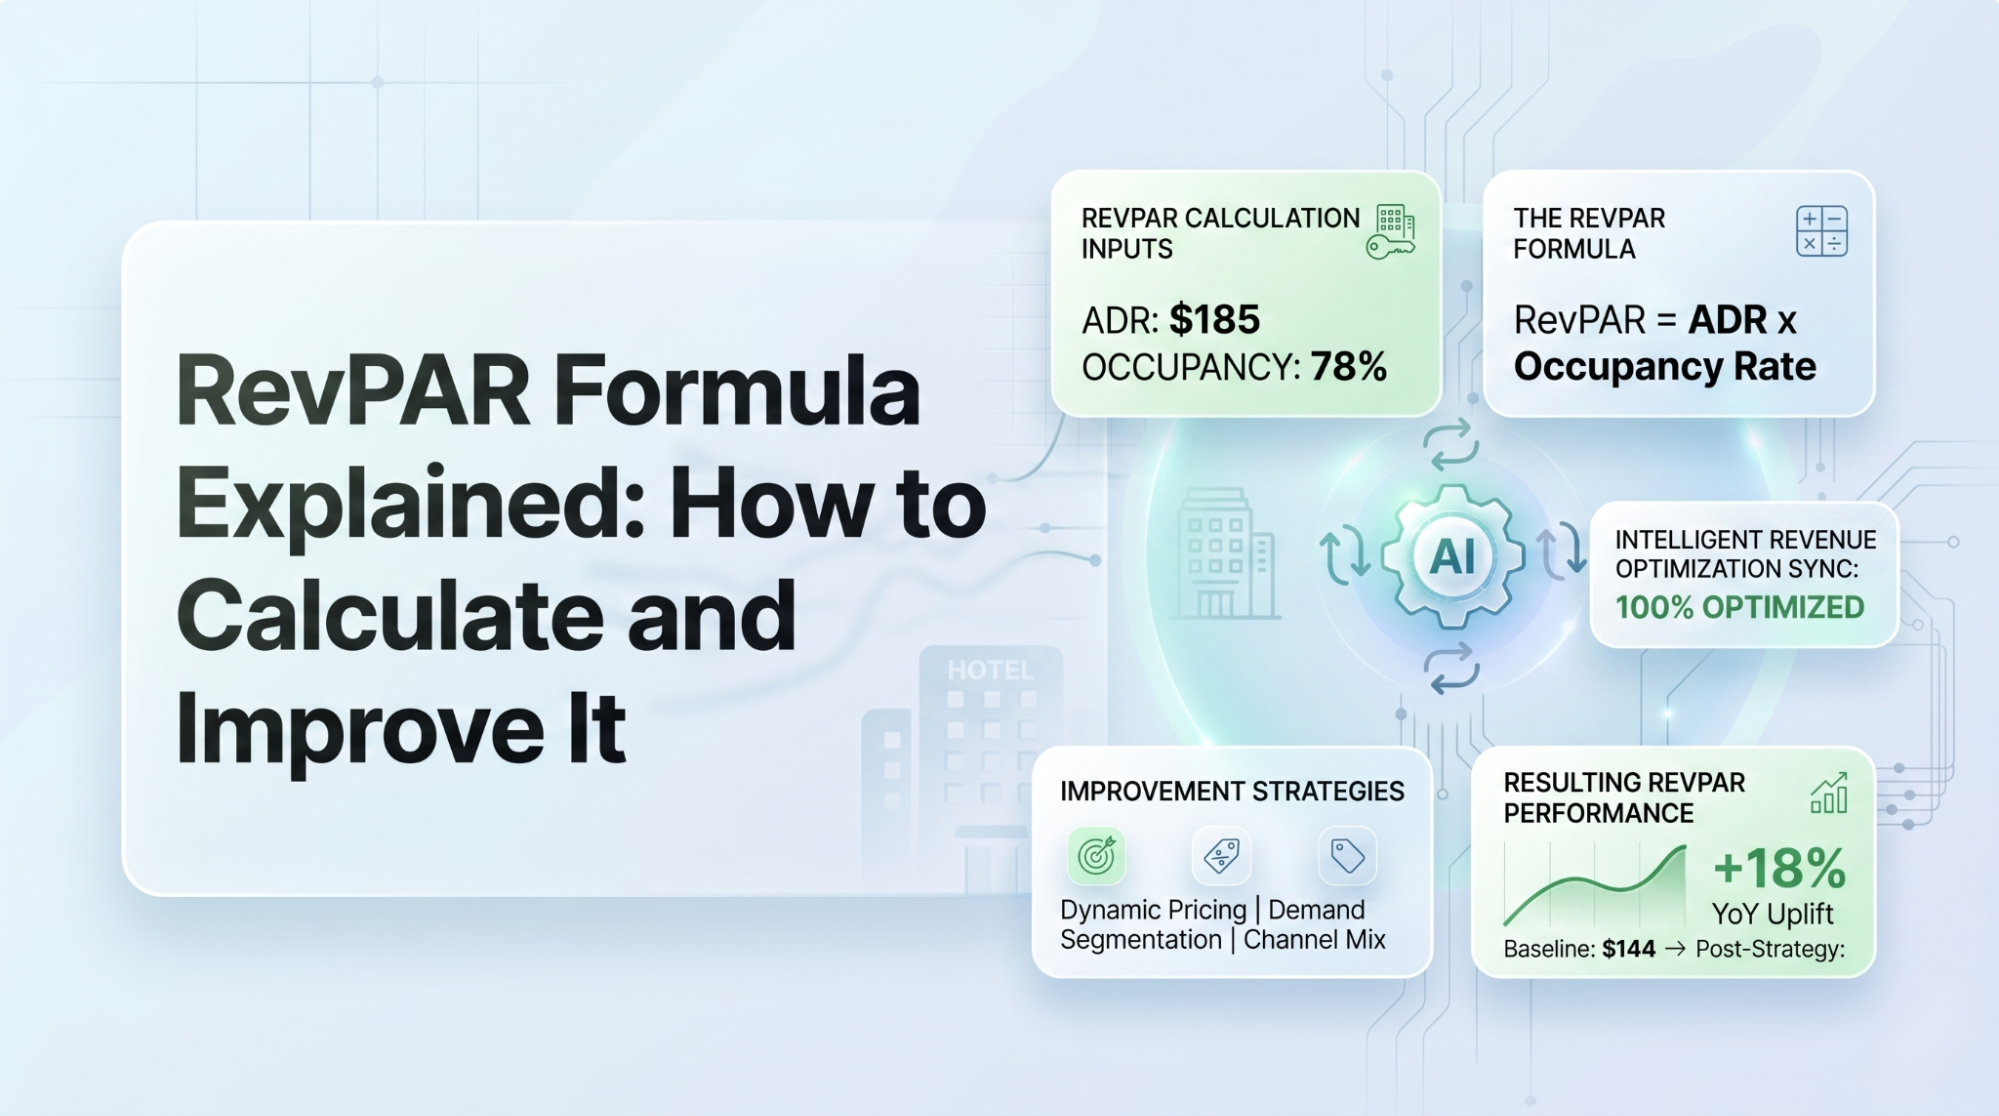
Occupancy is one leg of the metric triad. ADR tells you what you charged on the rooms you sold. Occupancy tells you how many of them you sold. RevPAR multiplies the two and tells you whether the combination actually worked. Any one of the three, read alone, will mislead you.
That is the whole reason occupancy gets misused. It is the most intuitive of the three — everyone understands a full hotel — so it becomes the number quoted in the Monday email and the owner call, even though it deliberately ignores price.
The Occupancy Rate Formula
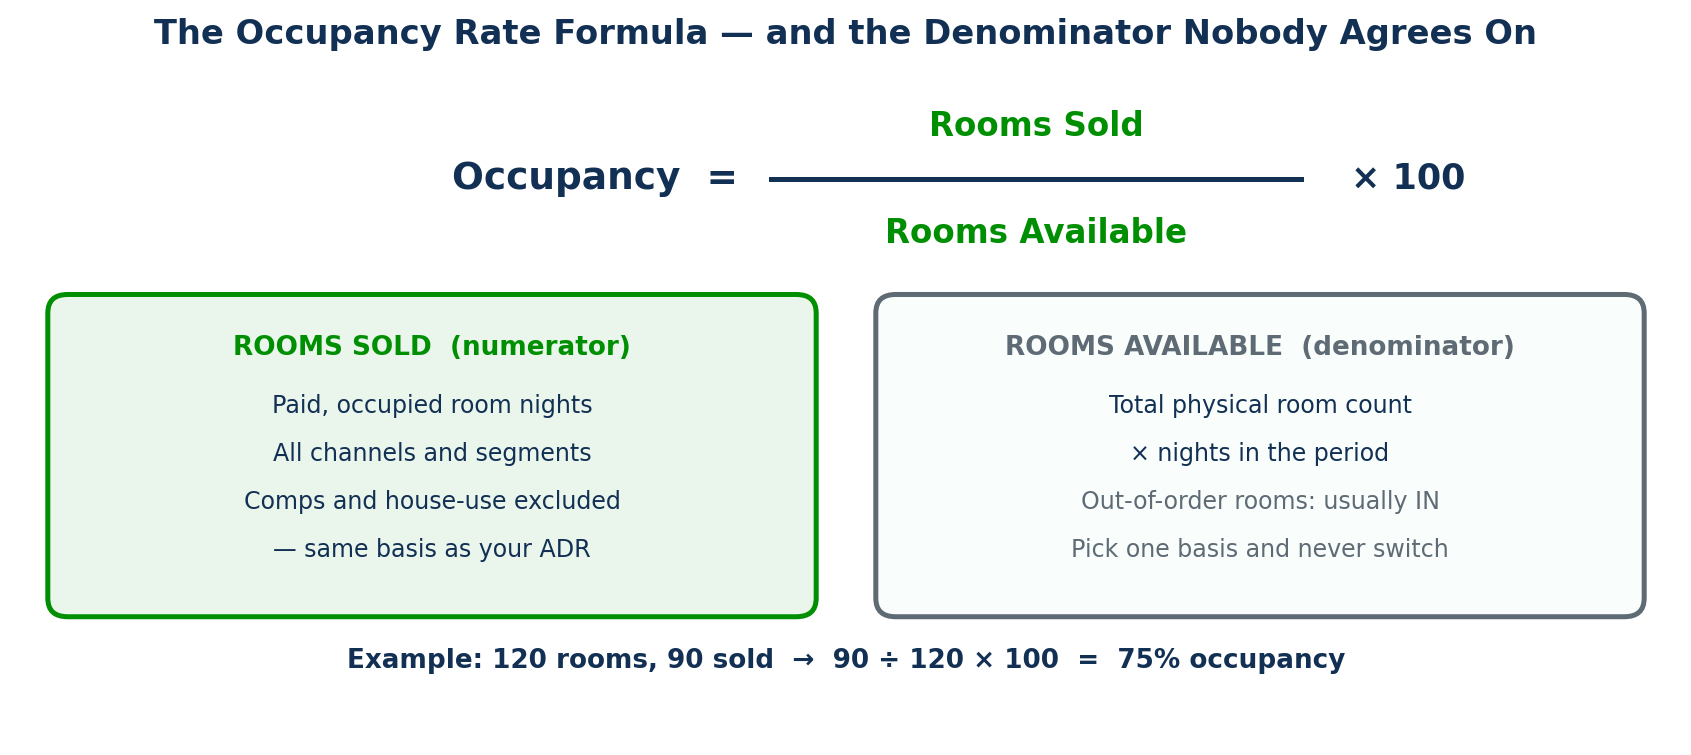
Two inputs, one division, one multiplication.
Single night
A 120-room hotel sells 90 rooms on Tuesday. Occupancy = 90 ÷ 120 × 100 = 75%.
A week, a month, a year
Extend the denominator by the number of nights. That same 120-room hotel across a 30-day month has 3,600 available room nights. If it sold 2,340 of them, occupancy = 2,340 ÷ 3,600 × 100 = 65%. The common error is dividing a month of rooms sold by a single night’s room count, which produces a nonsense number well over 100%.
Across a portfolio
Add all rooms sold across properties, divide by all available room nights across properties, multiply by 100. Do not average the individual occupancy percentages — that weights a 40-room boutique the same as a 400-room convention hotel. This is the sort of thing a portfolio view should handle for you rather than a spreadsheet.
The Denominator Question Nobody Warns You About
Here is the detail that changes your number and never appears in the standard formula guide: what counts as an available room?
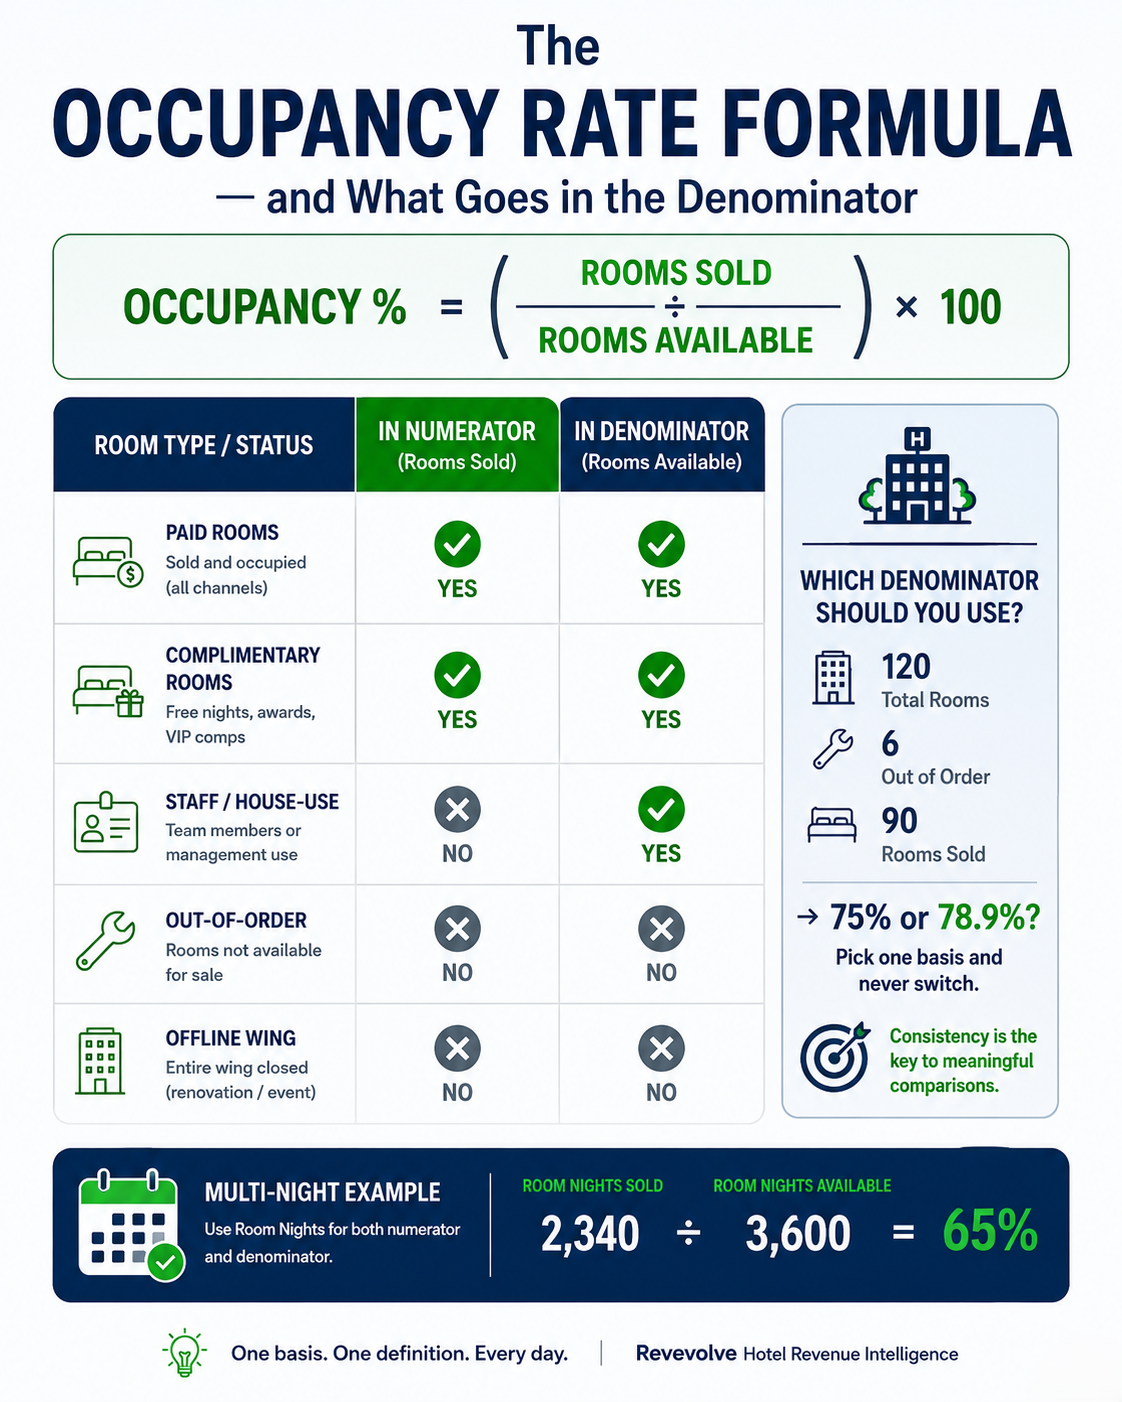
Say you have 120 physical rooms and 6 are out of order for a bathroom refit. You sell 90. Is your occupancy 75% (90 ÷ 120) or 78.9% (90 ÷ 114)?
Both calculations get used. Benchmarking convention generally keeps out-of-order rooms in the denominator — the rooms exist, and taking them offline was a business decision with a revenue cost. Operationally, some teams strip them out to judge how well they sold what they could actually sell.
| Room type | In “rooms sold”? | In “rooms available”? |
|---|---|---|
| Paid, occupied rooms | Yes | Yes |
| Complimentary rooms | No | Yes |
| Staff / house-use rooms | No | Yes |
| Out-of-order rooms | No | Usually yes — be consistent |
| Rooms not yet built / offline wing | No | No |
What Is a Good Occupancy Rate? The 2026 Benchmarks
This is where most occupancy guides go wrong, and it is worth being blunt about. Several widely-read pages state that a good hotel occupancy rate runs between 70% and 95%. That is not what the U.S. market produces.
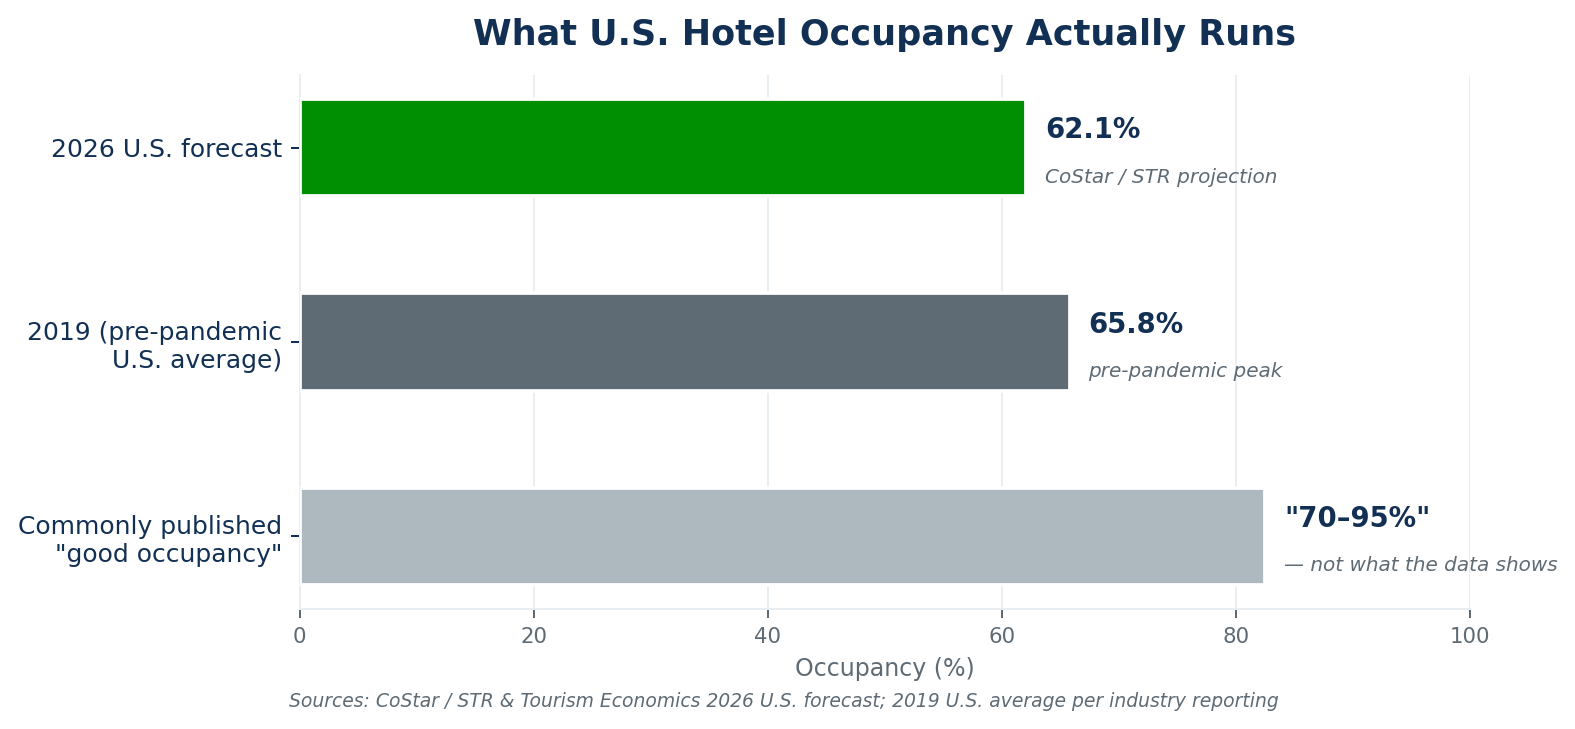
CoStar and Tourism Economics project U.S. hotel occupancy of roughly 62.1% for full-year 2026, with the metric expected to grow year over year after a soft 2025. Pre-pandemic, the 2019 U.S. average sat around 65.8% — still nowhere near 70%. Through April 2026, demand ran more than 8 million room nights ahead of the prior year, which is why the full-year outlook was revised upward.
So a property running 68% is not underperforming a “70–95% standard.” It is running comfortably above the national average. The 70–95% figure appears to describe peak-season performance at high-demand properties, presented as though it were a year-round baseline.
What actually varies the number
Chain scale, location, and season move occupancy far more than management quality does. Urban business hotels run high midweek and empty on weekends; resorts do the reverse. Budget properties often sustain higher occupancy at lower rates, while luxury properties frequently target lower occupancy at much higher ADR — and win on RevPAR doing it.
Occupancy vs ADR: The Trade-off That Settles the Argument
Every revenue meeting eventually arrives at the same debate. Drop rate to fill rooms, or hold rate and accept a softer night? Occupancy cannot answer it, because occupancy improves in exactly one direction and stays silent about the cost.
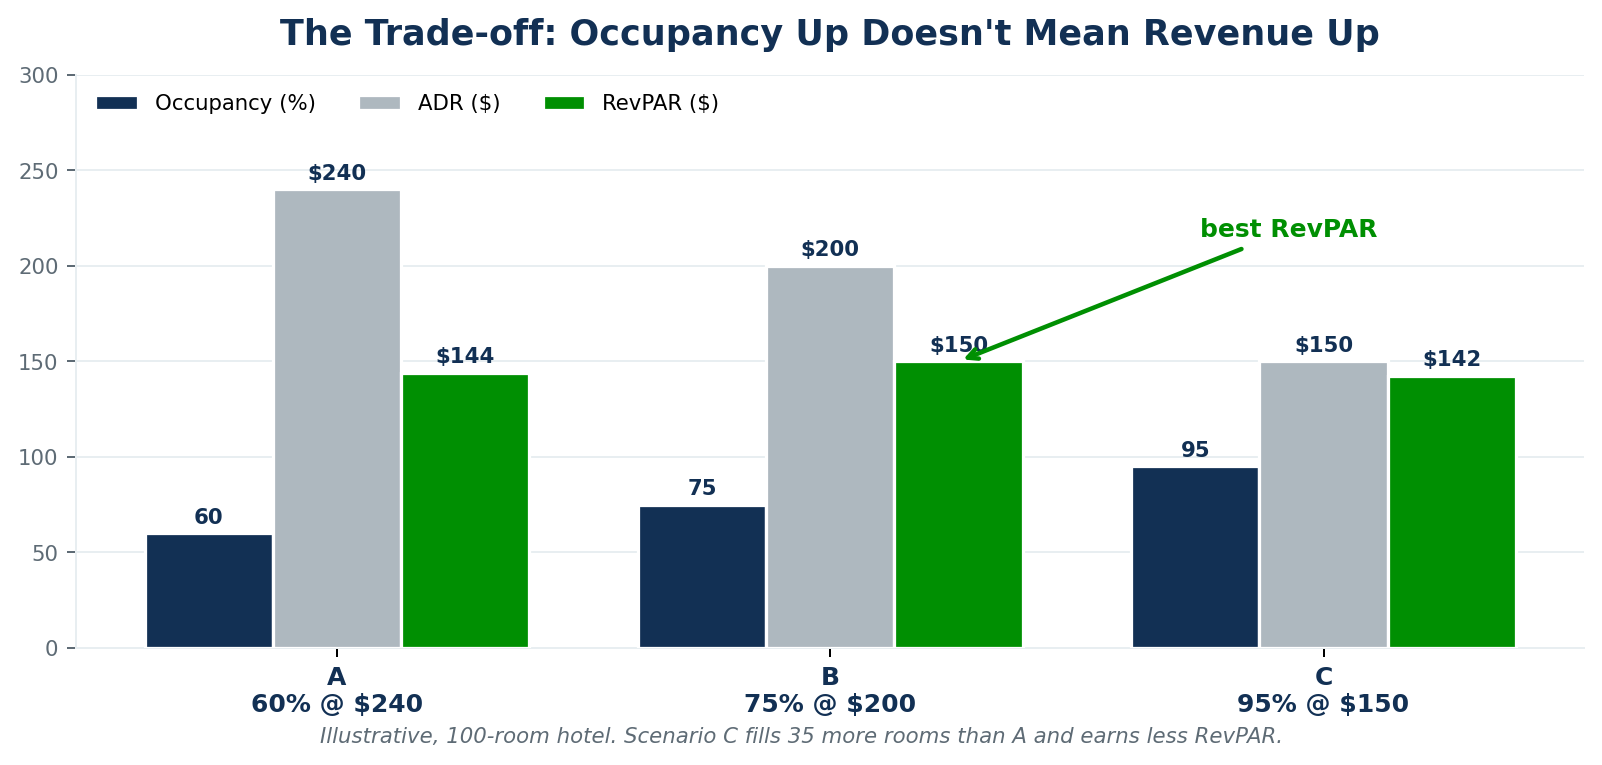
| Scenario | Occupancy | ADR | RevPAR | Verdict |
|---|---|---|---|---|
| A | 60% | $240 | $144 | Strong rate, soft volume |
| B | 75% | $200 | $150 | Best balance |
| C | 95% | $150 | $142.50 | Full hotel, least revenue |
Scenario C is the one that produces congratulatory emails. It is also the worst of the three. Ninety-five rooms occupied, more housekeeping, more wear, more breakfast covers, more front-desk load — and less room revenue than the night where thirty-five fewer rooms were sold. Once you factor operating costs per occupied room, the gap widens further, which is the argument for reading GOPPAR alongside RevPAR rather than stopping at the top line.
Why 100% Occupancy Is Usually Bad News
A sellout feels like the best possible outcome. In revenue management it is a flag, and the useful question is not whether you sold out but when.
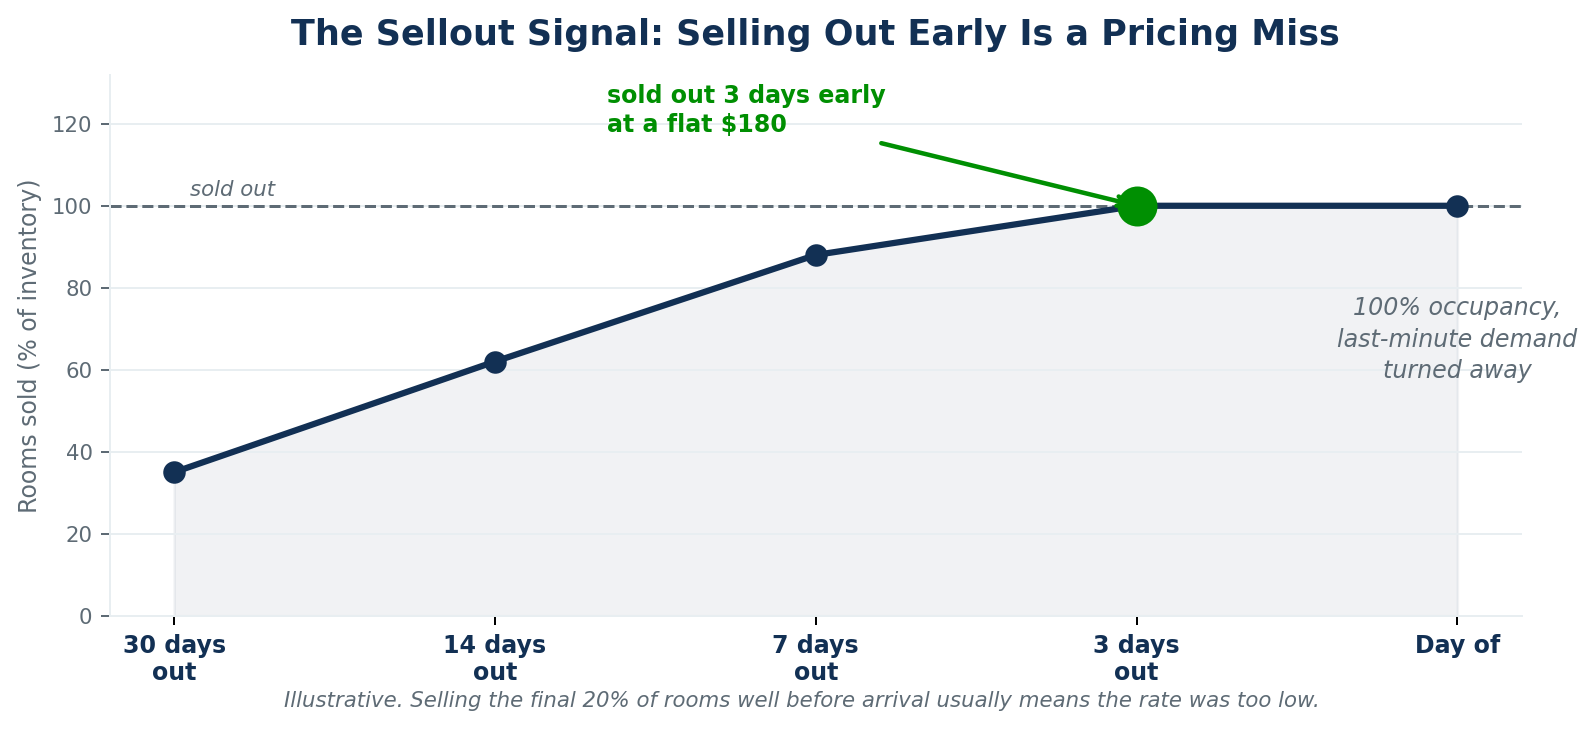
If you sell your last room three days before arrival at the same rate you were charging thirty days out, you priced that date for the demand you expected, not the demand you got. Every booking request that arrived after the sellout was demand you turned away — and last-minute demand is typically the least price-sensitive you will see.
A well-priced compression night sells its final rooms close to arrival, at a materially higher rate than it opened with. A sellout well in advance at a flat rate means the ceiling was set too low.
How to Improve Occupancy Without Wrecking Rate
When occupancy genuinely does need lifting — shoulder dates, soft midweek, a new opening — these move it without training your market to wait for discounts.
- Fill the pattern, not the month. Occupancy problems are rarely evenly distributed. A Sunday-through-Tuesday gap is a different problem, with a different fix, than a weekend gap.
- Use length-of-stay controls to bridge soft nights. A minimum-stay requirement on a strong date can pull demand into the weak night beside it — lifting the soft date without discounting the strong one.
- Open different segments, not lower rates. Soft midweek is often a segment problem. Corporate negotiated business, extended stay, or crew and group business can fill patterned gaps at controlled rates.
- Fence your discounts. Attach a condition — advance purchase, non-refundable, minimum stay, package inclusion. An unfenced discount is simply a lower rate available to guests who were going to book anyway.
- Price shoulder dates off the forecast, not off the calendar. Most soft dates are predictable weeks out. That is the job AI demand forecasting is built for.
Four Occupancy Mistakes to Stop Making
1 · Setting an occupancy target without a rate assumption
“Hit 85%” is achievable at any property on any date if you are willing to price low enough. Without a paired ADR floor, the target is an instruction to discount.
2 · Averaging occupancy across properties
Averaging percentages weights every hotel equally regardless of size. Always aggregate rooms sold and rooms available, then divide.
3 · Comparing your occupancy to a national figure
National averages blend chain scales, markets, and seasons you do not compete in. Your comp set is the only comparison that carries information.
4 · Celebrating the sellout without checking the timing
Covered above, and the most expensive habit on this list because it is reinforced every time somebody congratulates the team for it.
From Measuring Occupancy to Forecasting It
Everything above is backward-looking. Occupancy tells you how full you were; read with ADR and RevPAR, it tells you whether that fullness was worth it. What none of it tells you is how full you are going to be.
That is a forecasting question, and it is where the pricing decision actually lives. RM Copilot analyzes demand and pace across your own PMS data, projects occupancy per date, and recommends the rate with the reasoning attached — then lets you simulate the projected occupancy, ADR, and revenue impact before you commit. Your team reviews the recommendation and applies it.
The practical difference is timing. A pickup report tells you a date is soft after it has gone soft. A forecast tells you three weeks out, while there is still time to fix it with something other than a discount.
Worth separating two things people conflate: some hospitality AI is guest-facing — chat and messaging that help you talk to travelers. RM Copilot is operator-facing, working with your revenue team on the pricing decision itself.
Questions From the Revenue Meeting
Keep going: RevPAR formula explained · Average Daily Rate (ADR) · AI demand forecasting · Revenue management glossary.