We applied a dynamic pricing model that incorporated demand forecasting, local event data, and competitive benchmarking. Over a 6-month period, this led to a 12% increase in RevPAR. The key levers were correcting over-discounting in shoulder seasons, adjusting rates around local events, and giving revenue managers control via a pricing dashboard.
Key takeaways
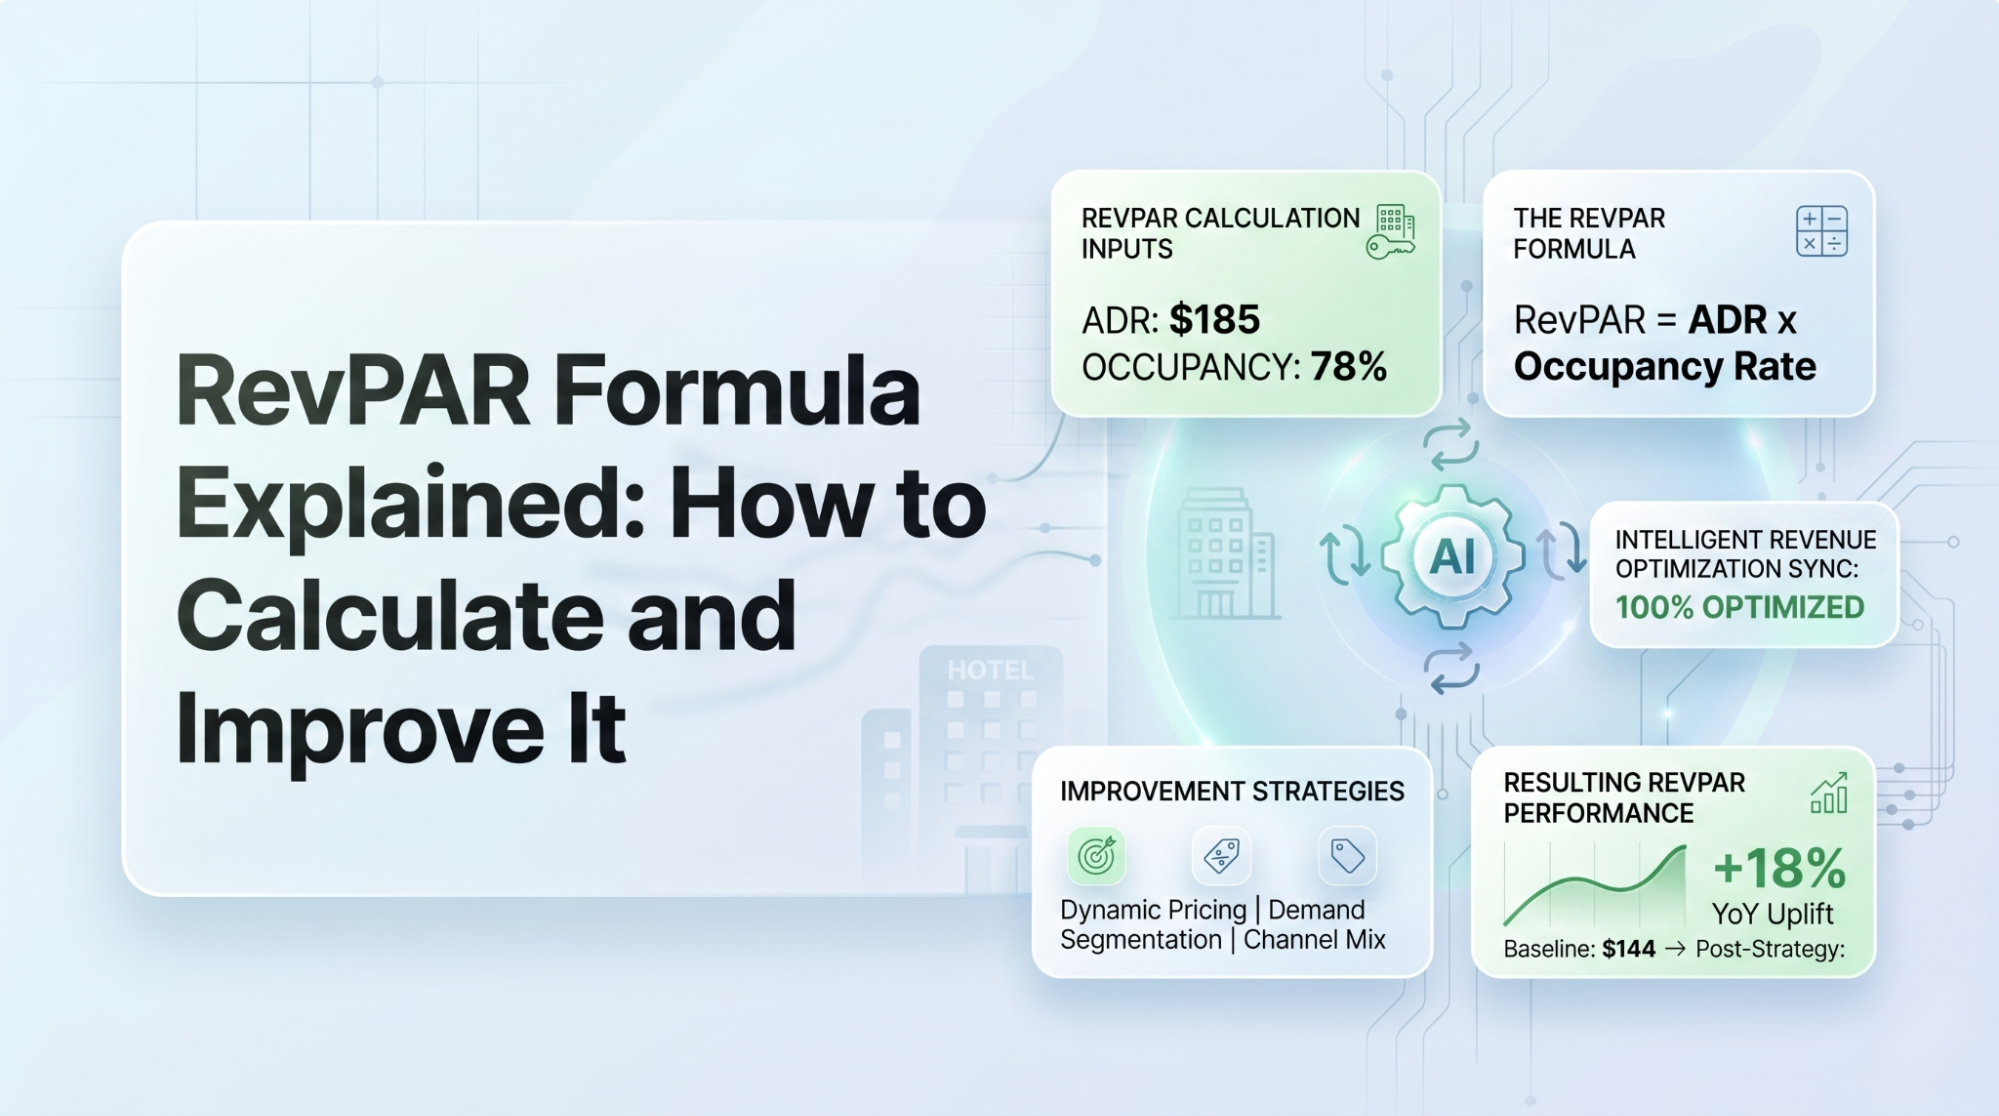
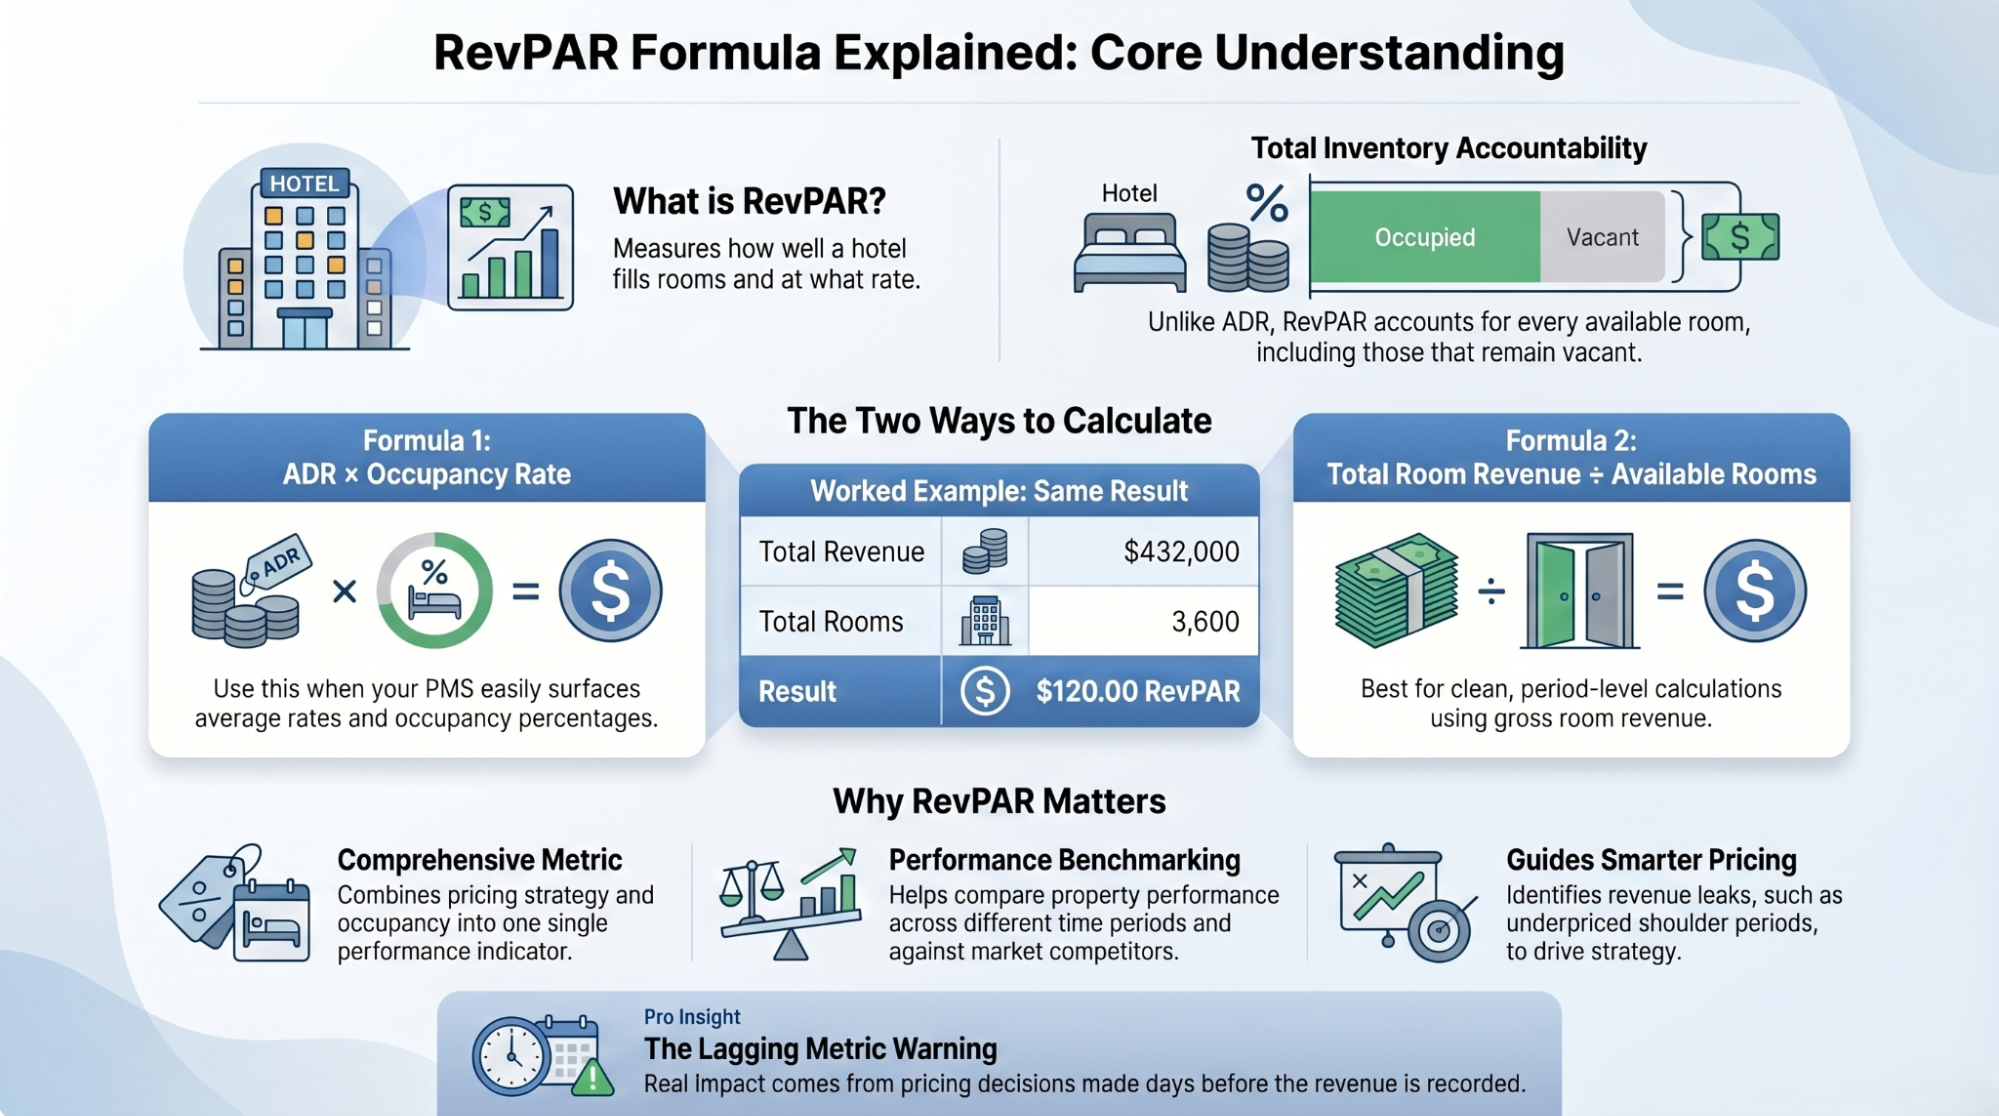
- RevPAR formula: Total Room Revenue ÷ Available Rooms. Equivalent: ADR × Occupancy %. Both produce the same number; the decomposition tells you what to do.
- Three valid RevPAR formulas exist for different purposes: accounting view (Formula 1), operator diagnostic (Formula 2 = ADR × Occ), and portfolio/period view (Formula 3 = Total Revenue ÷ Room-Days). Use the right one for the job.
- RevPAR alone doesn’t tell you whether you’re profitable or competitive - pair with GOPPAR (profitability) and STR’s RGI (competitive position) for the complete picture.
- Industry RevPAR benchmarks (US, 2025): Economy ~$56, Midscale ~$80, Upscale ~$120, Upper Upscale ~$165, Luxury ~$298. Within a chain scale, top-quartile properties run +20–30% above the scale median.
- AI dynamic pricing produces the largest observed RevPAR lift among single-tactic improvements (median +4–6%, top quartile +12%). Reddit operators report 12% lift in 6 months on a 3-city group.
- Five compounding levers - BAR optimization, length-of-stay rate fences, channel mix shift, event-day pricing, group displacement discipline - typically combine for +12–18% RevPAR in a quarter on properties starting from a manual baseline.
Try the free RevEvolve RevPAR Calculator - enter rooms sold, available rooms, and total room revenue; instant RevPAR + ADR + Occupancy + chain-scale benchmark comparison + improvement opportunity scan. Available at revevolve.ai/tools/revpar-calculator/.
What Is RevPAR? The Definition Most Guides Get Wrong
RevPAR (Revenue Per Available Room) measures how much room revenue a hotel generates per available room - whether or not that room is sold. The "available" part is what trips most operators up. RevPAR uses all rooms in inventory as the denominator, including unsold rooms, rooms out of order, and rooms held for VIPs. Unlike ADR (which only counts sold rooms), RevPAR penalizes empty rooms by spreading revenue across the full inventory.
That single distinction is what makes RevPAR the single most-used hotel metric: it captures both pricing power (ADR) and demand capture (occupancy) in one number. A property charging $400 ADR with 30% occupancy has the same RevPAR ($120) as one charging $150 ADR at 80% occupancy. Same headline number, completely different business.
RevPAR is the hotel industry’s closest equivalent to 'revenue per unit of capacity' - the same way airlines measure RASM (Revenue per Available Seat Mile) or theaters measure revenue per seat. It works because room inventory is fixed and perishable: an empty room tonight cannot be sold tomorrow. Capacity utilization at ADR is the entire P&L conversation in one metric.
What RevPAR is not
RevPAR is frequently confused with three related-but-different metrics. Operators who get the distinctions wrong make consistently bad decisions:
| Metric | Formula | What it captures | When to use |
|---|---|---|---|
| RevPAR | Room revenue ÷ available rooms | Room revenue per unit of capacity | Daily/weekly performance, comp set benchmarking |
| ADR | Room revenue ÷ rooms sold | Average price per sold room | Pricing strategy, rate ladder analysis |
| Occupancy | Rooms sold ÷ available rooms | Demand capture rate | Distribution effectiveness, segment mix |
| TRevPAR | Total revenue ÷ available rooms | Total revenue (rooms + F&B + ancillary) per room | Full-property profitability, ancillary strategy |
| GOPPAR | Gross operating profit ÷ available rooms | Operating profit per room | Owner reporting, asset management |
The Three Valid RevPAR Formulas
There isn’t one RevPAR formula - there are three, and they all produce the same number for the same period. The difference is which decision they support. Operators who only know Formula 1 miss the diagnostic value of Formula 2, and the portfolio reporting value of Formula 3.
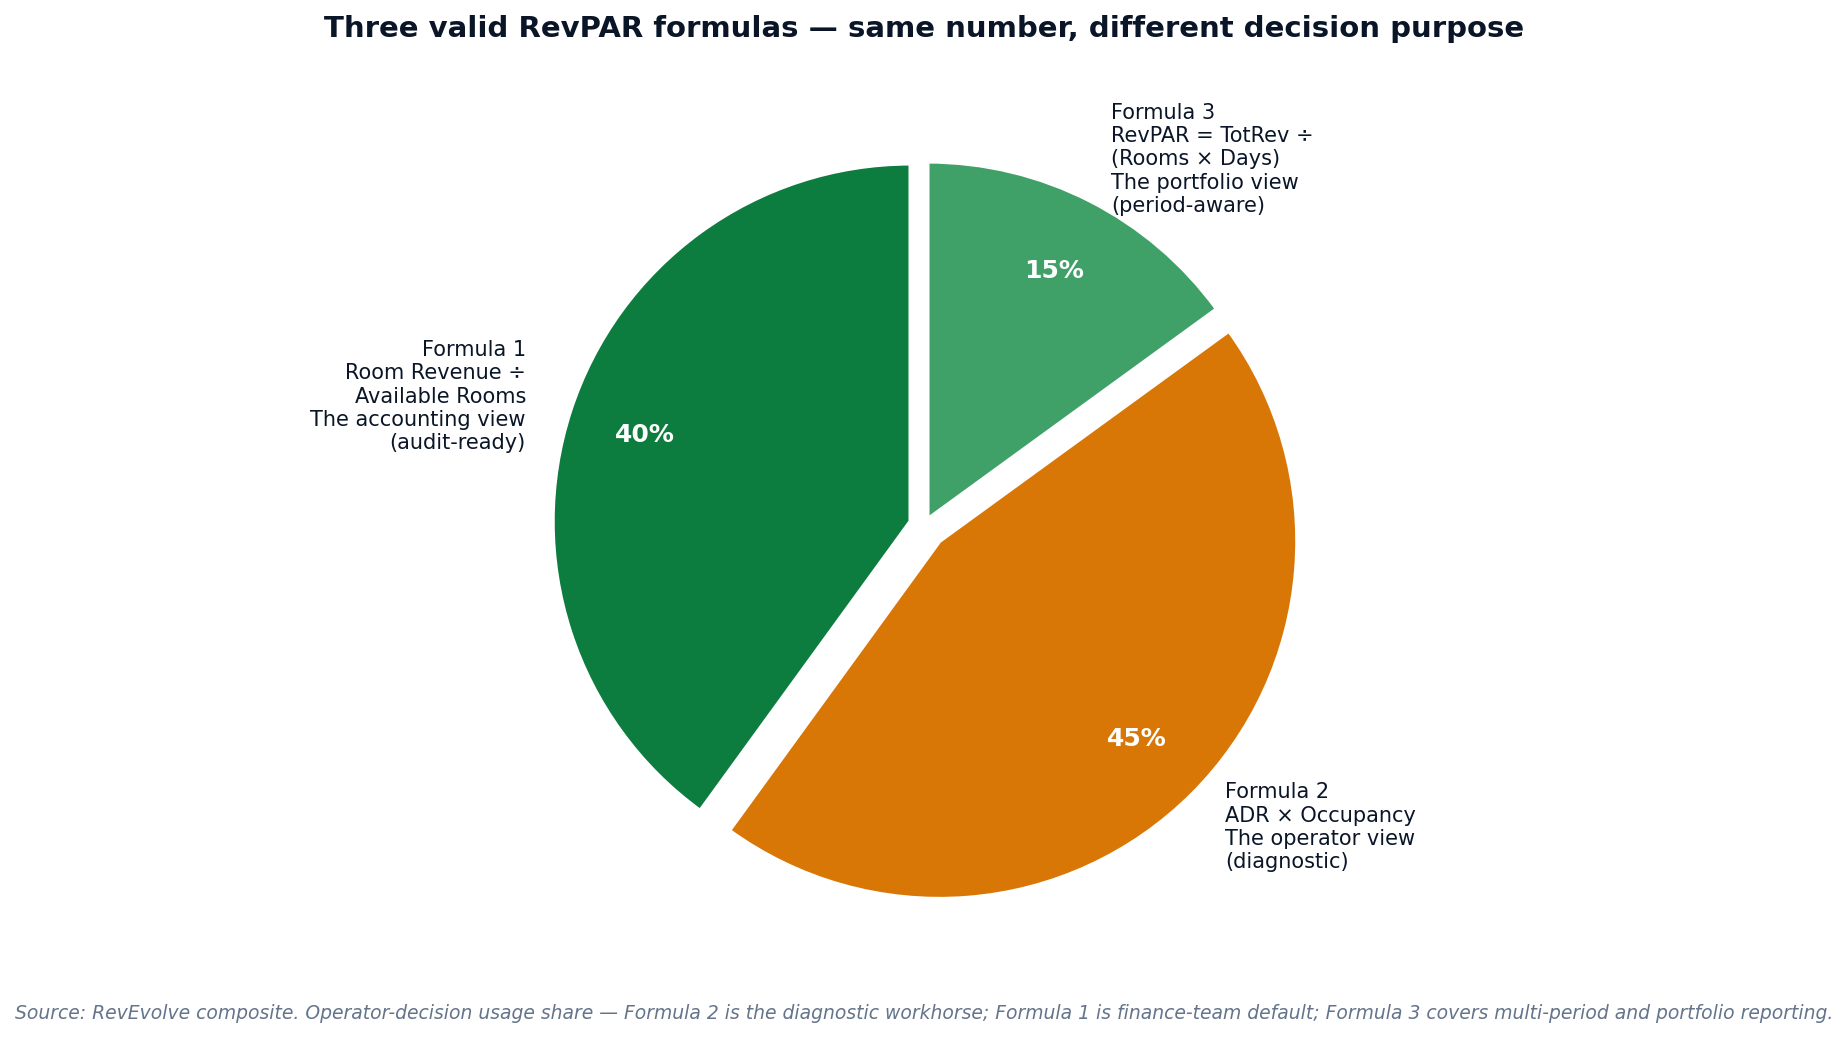
Formula 1 - Total Room Revenue ÷ Available Rooms (the accounting view)
The cleanest accounting definition. "Available rooms" means total rooms in inventory × number of nights in the period (a 100-room property over 30 days has 3,000 available room-nights). Use this formula when:
- Reconciling against the P&L (room revenue line directly from the GL)
- Reporting to ownership or asset managers
- Year-over-year and budget-vs-actual comparisons
- Audit or compliance reporting where the source data must trace to financial statements
Formula 2 - ADR × Occupancy Rate (the diagnostic view)
Mathematically identical to Formula 1, but operationally far more useful. Decomposing RevPAR into ADR × Occupancy lets you isolate whether a change is rate-driven or volume-driven - which determines what to do about it.
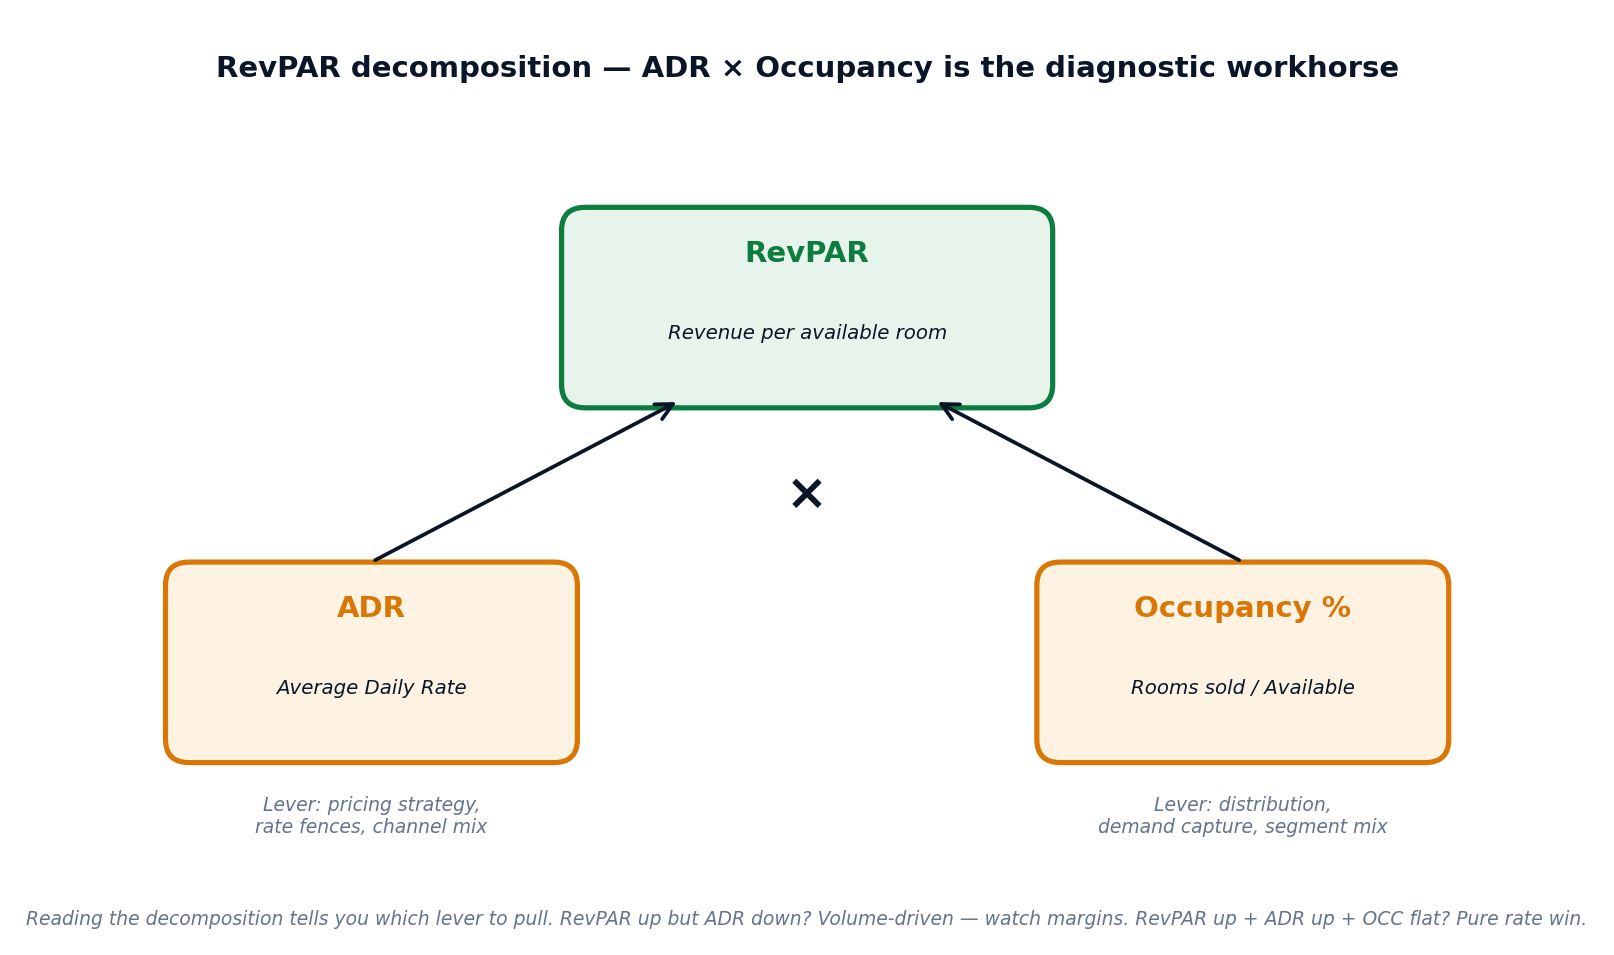
| Pattern | What it means | Action |
|---|---|---|
| RevPAR up, ADR up, Occ flat | Pure rate win - you found pricing headroom | Sustain; test further rate increases |
| RevPAR up, ADR flat, Occ up | Pure volume win - distribution or demand capture improved | Sustain; consider testing rate ceiling |
| RevPAR up, ADR up, Occ down | Rate-driven, volume bleeding - watch for elasticity ceiling | Hold rate; if MPI continues falling, reduce |
| RevPAR up, ADR down, Occ up | Volume-driven discounting - watch margins (TRevPAR + GOPPAR) | Test 2–3% rate increase; verify margin holds |
| RevPAR down, ADR down, Occ down | Compounding underperformance | Investigate root cause: comp set drift, brand, distribution |
| RevPAR down, ADR up, Occ down | Over-priced for the market | Reduce BAR by 3–7%; expect occupancy recovery |
Formula 3 - Total Room Revenue ÷ (Rooms × Days) (the portfolio view)
Same math as Formula 1, but explicit about the time dimension. Use Formula 3 when comparing across periods of different length (a 28-day February vs a 31-day March), aggregating across multiple properties of different sizes, or computing rolling RevPAR. The denominator (Rooms × Days) is sometimes called "available room-nights" - it’s the unit of capacity the period actually had.
Worked Examples - RevPAR Calculation in Practice
Three worked examples covering daily, monthly, and multi-property RevPAR calculation. Run the formulas yourself; the math is intentionally arithmetic so you can audit each step.
Example 1 - Daily RevPAR for a 100-room property
| Input | Value |
|---|---|
| Available rooms | 100 |
| Rooms sold (one night) | 78 |
| Total room revenue (one night) | $15,210 |
| ADR (Room revenue ÷ Rooms sold) | $15,210 ÷ 78 = $195 |
| Occupancy (Rooms sold ÷ Available rooms) | 78 ÷ 100 = 78% |
| RevPAR (Formula 1: Revenue ÷ Available) | $15,210 ÷ 100 = $152.10 |
| RevPAR (Formula 2: ADR × Occupancy) | $195 × 0.78 = $152.10 |
Example 2 - Monthly RevPAR for the same property (March, 31 days)
| Input | Value |
|---|---|
| Available rooms (Rooms × Days) | 100 × 31 = 3,100 available room-nights |
| Rooms sold across March | 2,387 |
| Total room revenue across March | $481,124 |
| ADR (Revenue ÷ Rooms sold) | $481,124 ÷ 2,387 = $201.56 |
| Occupancy (Rooms sold ÷ Available) | 2,387 ÷ 3,100 = 77.0% |
| RevPAR (Formula 3: Revenue ÷ Room-Nights) | $481,124 ÷ 3,100 = $155.20 |
| Cross-check (Formula 2: ADR × Occupancy) | $201.56 × 0.770 = $155.20 ✓ |
Example 3 - Portfolio RevPAR across 3 properties (one month)
| Property | Rooms | Available room-nights (× 30) | Revenue | Property RevPAR |
|---|---|---|---|---|
| Hotel A | 100 | 3,000 | $465,000 | $155.00 |
| Hotel B | 180 | 5,400 | $702,000 | $130.00 |
| Hotel C | 60 | 1,800 | $324,000 | $180.00 |
| **PORTFOLIO TOTAL** | **340** | **10,200** | **$1,491,000** | **$146.18** |
Watch the math: portfolio RevPAR is not the simple average of the three property RevPARs ($155 + $130 + $180) ÷ 3 = $155. It’s the room-night-weighted average: $1,491,000 ÷ 10,200 = $146.18. Hotel B has more room-nights and a lower RevPAR, which pulls the portfolio number down. Always weight by available room-nights when aggregating, never by property count.
Industry RevPAR Benchmarks - Where Do You Stack Up?
A RevPAR number in isolation is meaningless - $150 is excellent for an Economy property and disastrous for a Luxury one. The first benchmark question is always: how does our RevPAR compare to others in the same chain scale and market?
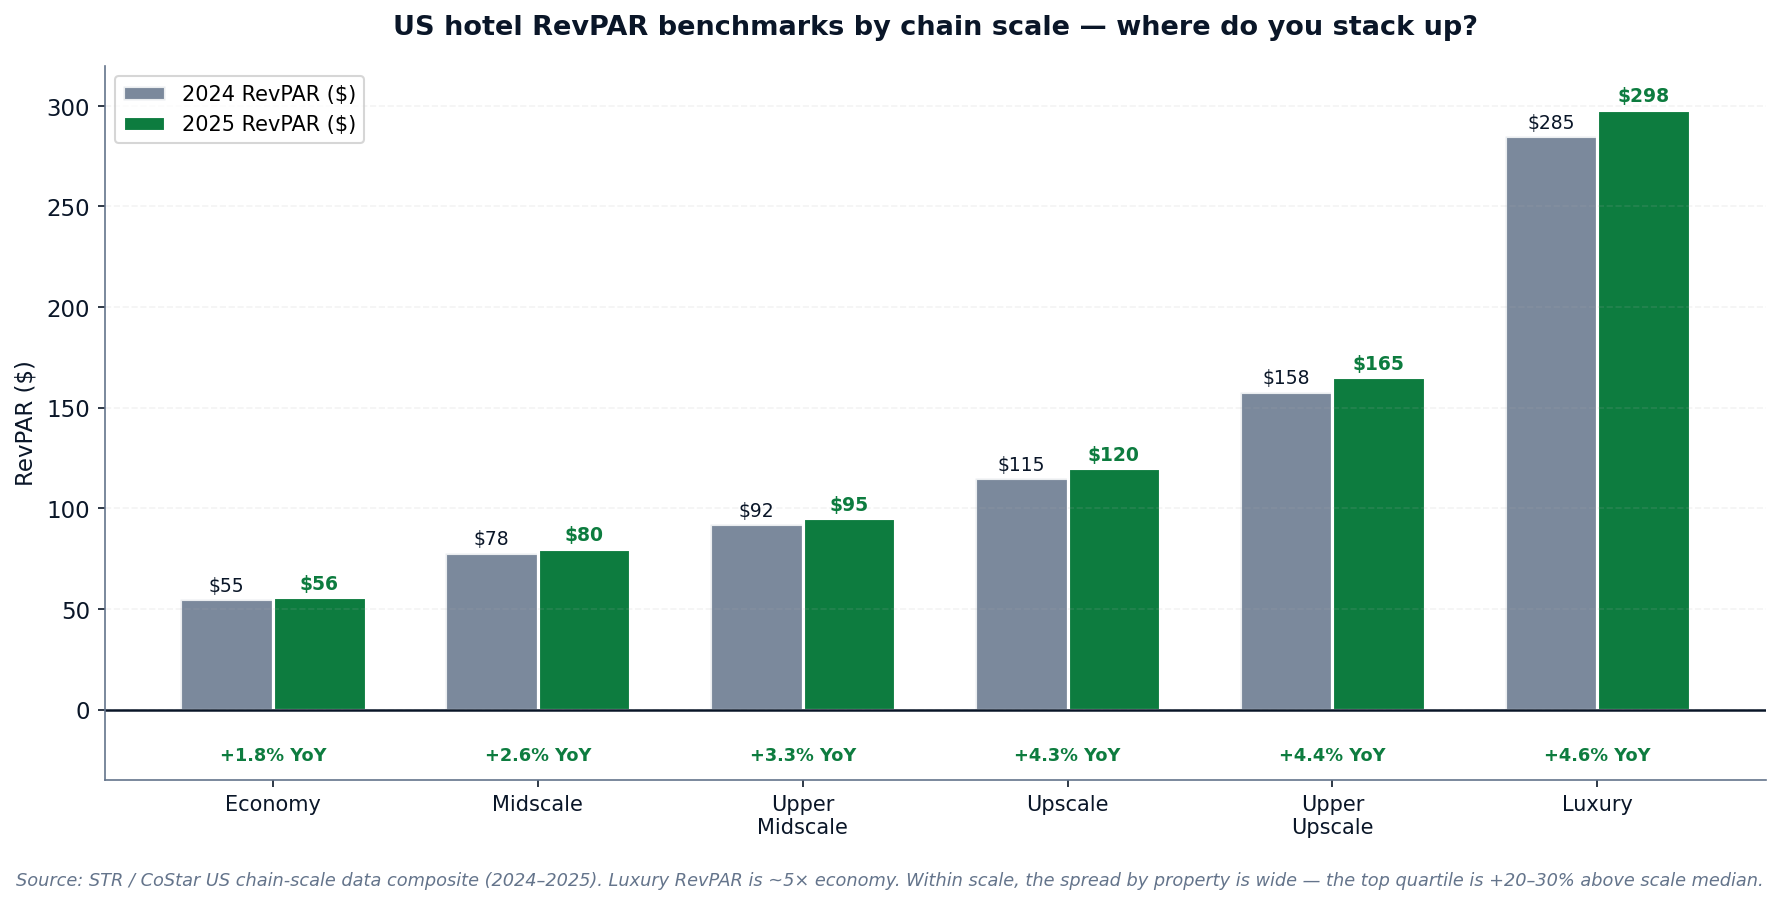
| Chain scale | 2024 RevPAR | 2025 RevPAR | YoY change | Typical ADR | Typical occupancy |
|---|---|---|---|---|---|
| Economy | $55 | $56 | +1.8% | $82 | ~68% |
| Midscale | $78 | $80 | +2.6% | $115 | ~70% |
| Upper Midscale | $92 | $95 | +3.3% | $138 | ~69% |
| Upscale | $115 | $120 | +4.3% | $175 | ~69% |
| Upper Upscale | $158 | $165 | +4.4% | $245 | ~67% |
| Luxury | $285 | $298 | +4.6% | $480 | ~62% |
Reading the benchmarks correctly
- Use chain scale benchmarks as a first-pass sanity check, not as a target. Your true target is the 75th percentile of your specific comp set in your specific market.
- Within-scale variance is wide. A Midscale property at $80 RevPAR is at the median; a top-quartile Midscale property runs $96–$104. The spread is real and persistent.
- Higher chain scales have lower occupancy. Luxury properties run ~62% occupancy; Economy runs ~68%. The trade-off is intentional - Luxury monetizes scarcity at premium ADR.
- Geography matters more than scale in many markets. A Midscale in Manhattan can outperform a Luxury in a tertiary market. Use your STR comp set, not the national chain-scale benchmark, for serious analysis.
How to Improve RevPAR - The 8 Tactics That Actually Work
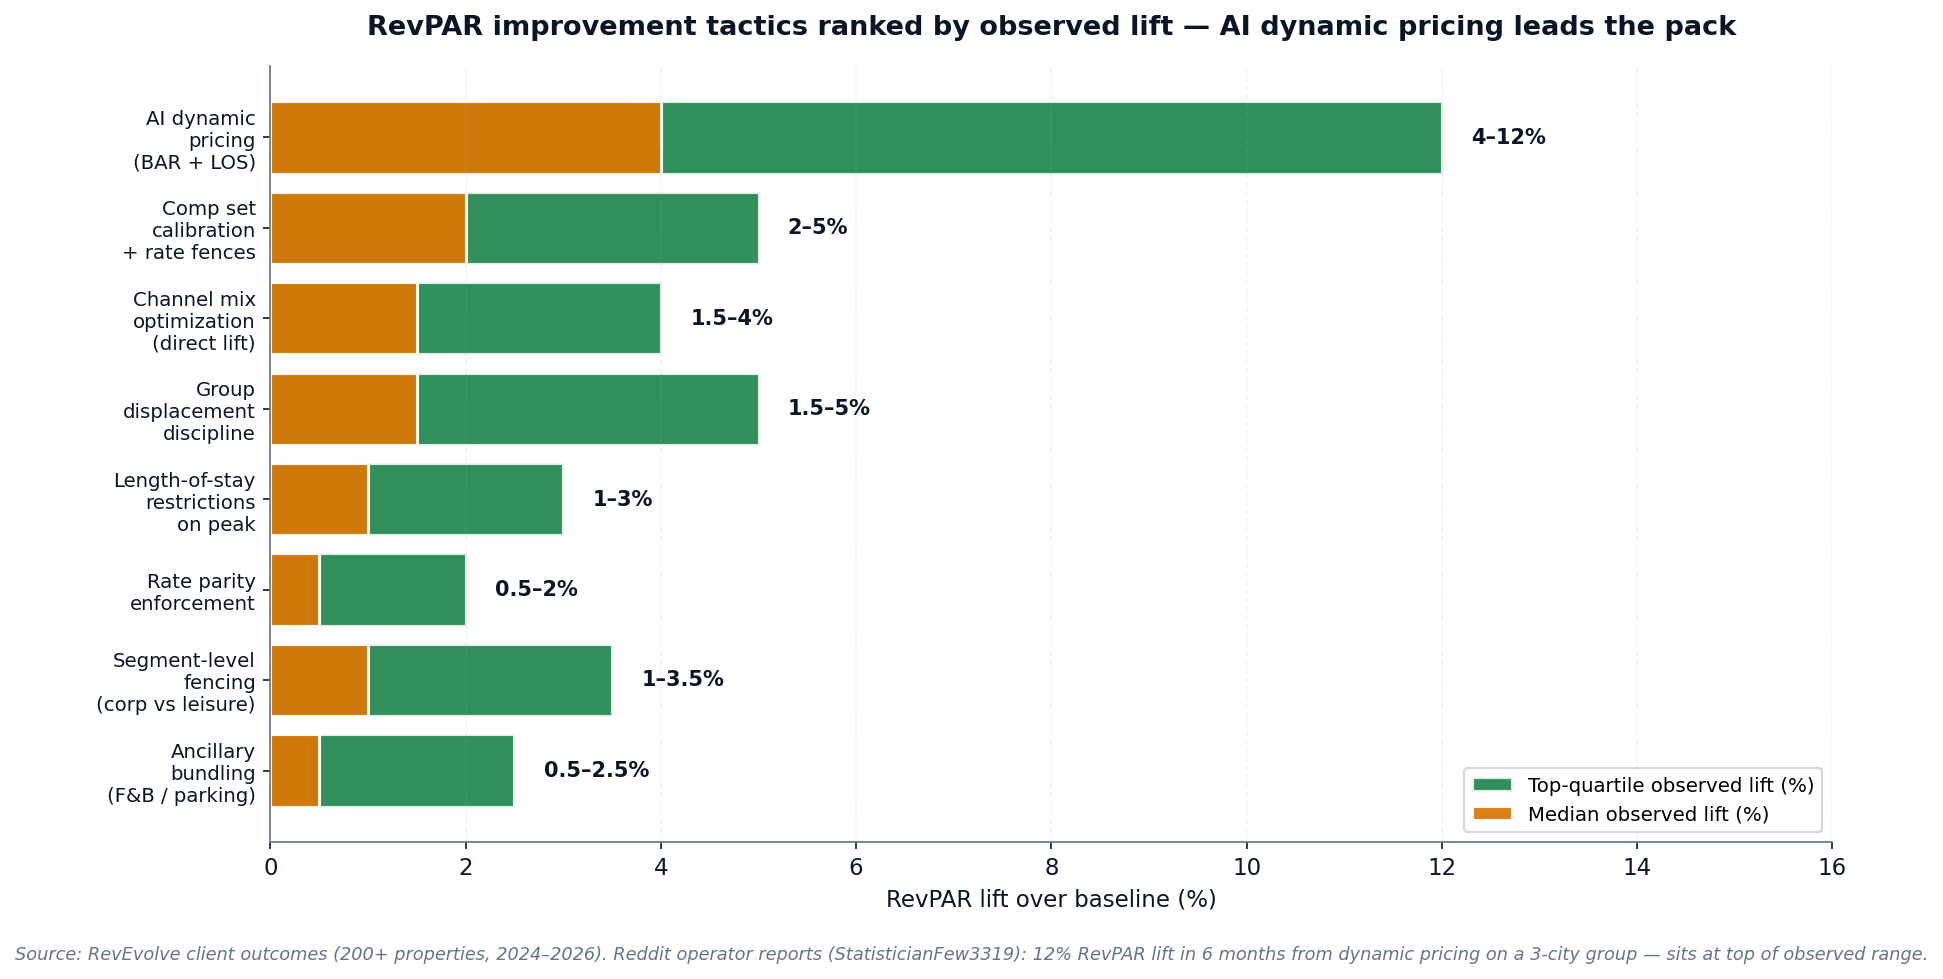
RevPAR improvement is not one decision - it’s a stack of compounding tactics, each producing a few percentage points of lift. Properties that systematically apply 5–6 of these tactics over a quarter typically see +12–18% RevPAR against their pre-discipline baseline. The Reddit operator on a 3-city group saw +12% over 6 months from dynamic pricing alone; properties layering more tactics see more.
Tactic 1 - AI dynamic pricing (BAR + LOS)
Continuously updating BAR and length-of-stay rate ladders based on AI demand forecasting. Replaces manual weekly pricing decisions with continuous optimization. Top-tier observed lift: 12% over 6 months on a 3-city group (Reddit operator confirmation). Median lift: 4–6%. The single largest single-tactic lever.
Observed lift range: 4–12% (median → top-quartile)
Tactic 2 - Comp set calibration + rate fences
Quarterly comp set audit (4-criteria check) + rate fences that prevent leakage between segments and channels. Most properties have stale comp sets producing false signals; fixing this alone produces 2–5% RevPAR.
Observed lift range: 2–5% (median → top-quartile)
Tactic 3 - Channel mix optimization (direct lift)
Shifting bookings from high-commission OTAs (15–25% commission) toward direct channels (1–3% cost). Even a 5-point shift toward direct produces measurable RevPAR lift after channel cost normalization.
Observed lift range: 1.5–4% (median → top-quartile)
Tactic 4 - Group displacement discipline
Running the 4-step displacement calculation on every group inquiry. Rejecting unprofitable groups and counter-offering on alternative dates. Reclaims peak-date transient revenue currently being given away to under-priced groups.
Observed lift range: 1.5–5% (median → top-quartile)
Tactic 5 - Length-of-stay restrictions on peak dates
2-night minimums on peak Saturdays during high-demand periods. Forces longer stays at premium rates; eliminates single-night premium leakage. High-leverage on event weekends and holiday periods.
Observed lift range: 1–3% (median → top-quartile)
Tactic 6 - Rate parity enforcement
Ensuring no channel undercuts your direct rate. Even small parity violations (5–7% discount on metasearch) train guests to comparison-shop and reduce direct conversion. Strict enforcement protects RevPAR over multiple quarters.
Observed lift range: 0.5–2% (median → top-quartile)
Tactic 7 - Segment-level fencing (corporate vs leisure)
Distinct rate ladders for corporate negotiated rates vs leisure transient. Prevents leisure guests from booking corporate rates; prevents corporate guests from defaulting to BAR when corporate rates aren’t shown. Restoring fence integrity often produces 1–3% RevPAR.
Observed lift range: 1–3.5% (median → top-quartile)
Tactic 8 - Ancillary bundling (F&B / parking)
Bundling room + breakfast / room + parking / room + amenity into single packages at higher ADR. Increases the ADR component of RevPAR while improving guest perceived value. Most properties under-utilize this lever.
Observed lift range: 0.5–2.5% (median → top-quartile)
No single tactic compounds to a transformational lift on its own. The discipline that produces sustained +15% RevPAR over a quarter is layering 5–6 tactics simultaneously, each producing a few points, with the combined effect compounding multiplicatively rather than additively. The math: 1.05 × 1.03 × 1.04 × 1.02 × 1.02 = 1.166, or +16.6%.
Worked Quarterly RevPAR Improvement - +16% in 12 Weeks
A 100-room urban property starts Q1 with RevPAR of $142 (Midscale benchmark territory - Upper Midscale aspirational). Over 12 weeks, the operator applies 5 compounding tactics. Here’s the math by lever:
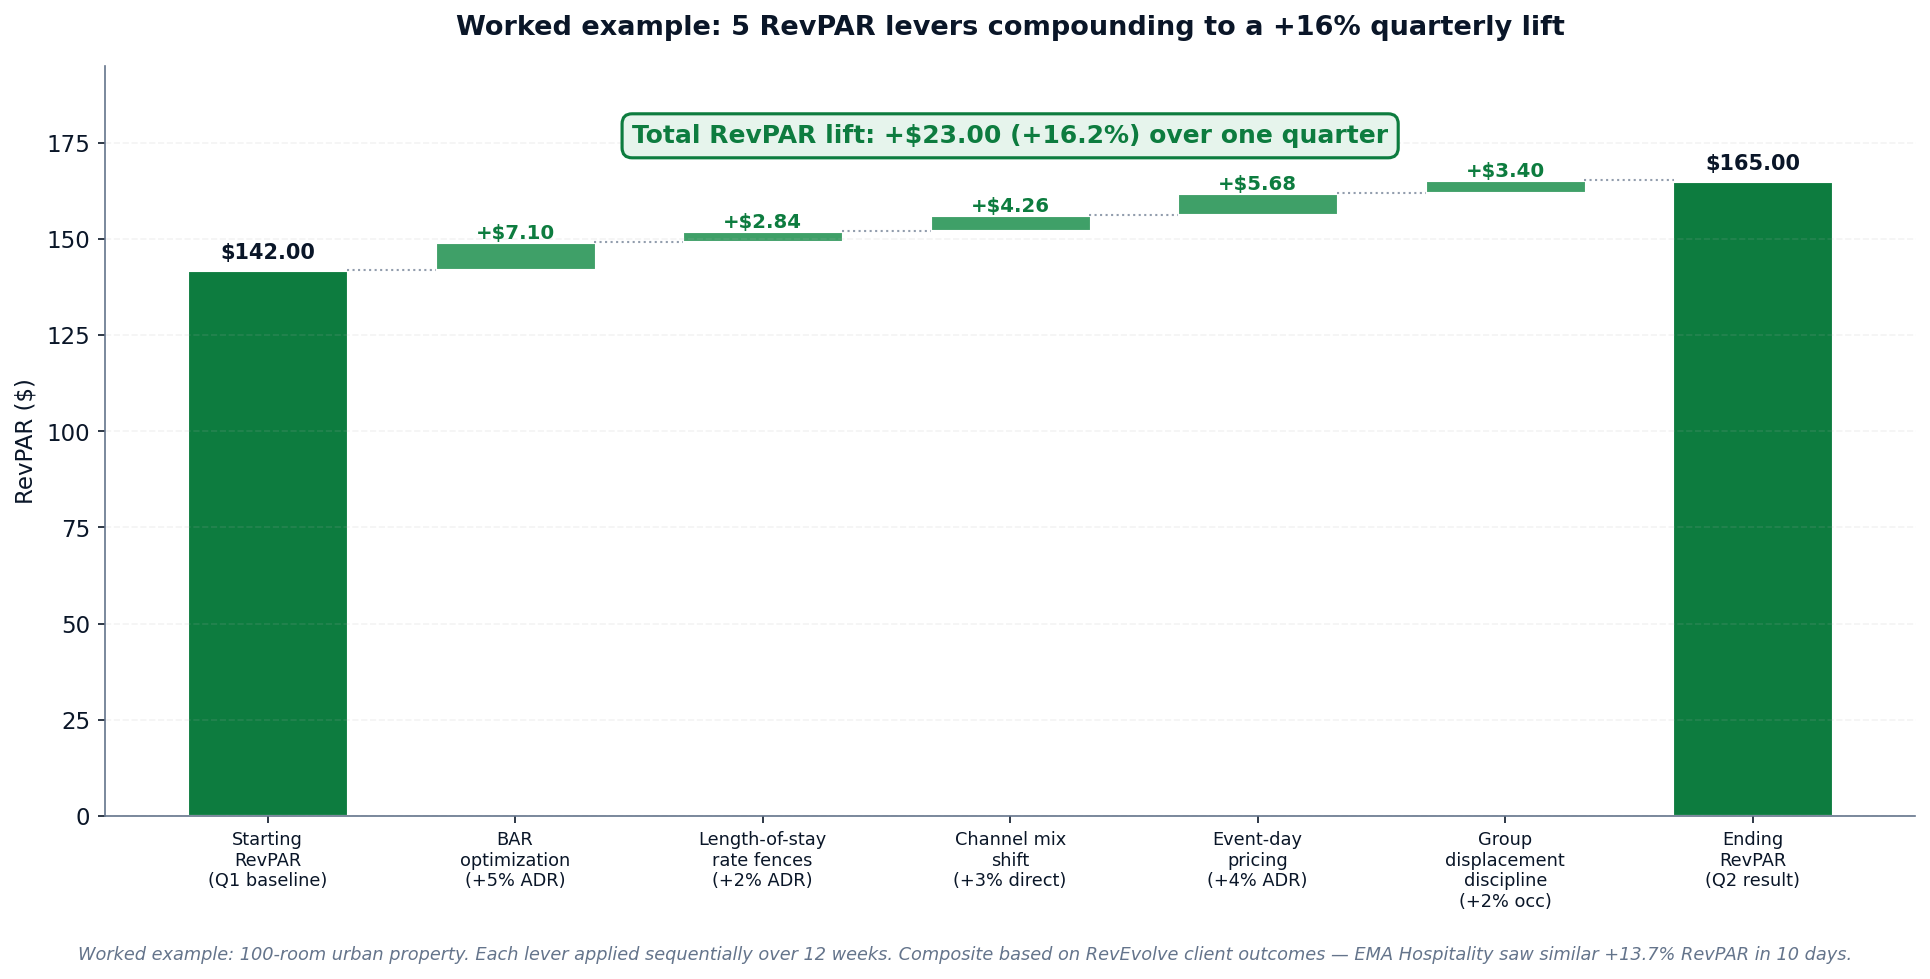
| Week | Lever applied | Single-lever lift | Cumulative RevPAR |
|---|---|---|---|
| Baseline | Q1 baseline (manual workflow) | - | $142.00 |
| Weeks 1–3 | BAR optimization (AI dynamic pricing) | +5.0% ADR | $149.10 |
| Weeks 4–6 | Length-of-stay rate fences (peak dates) | +2.0% ADR | $151.94 |
| Weeks 5–8 | Channel mix shift (+3pt direct) | +2.8% blended | $156.20 |
| Weeks 7–10 | Event-day pricing (premium capture) | +3.6% ADR | $161.88 |
| Weeks 9–12 | Group displacement discipline | +2.0% occupancy | $165.00 |
| **Q2 result** | **Cumulative quarterly RevPAR lift** | **+16.2%** | **$165.00** |
Why levers compound multiplicatively, not additively: when BAR optimization lifts ADR by 5%, every subsequent lever applies to the new (higher) ADR base. Length-of-stay rate fences add 2% on the lifted base, not the original. Event-day pricing applies to the further-lifted base. The compounding is what produces the meaningful net result - 16.2% from 5 individually-modest levers.
Spend 8–10 hours weekly on competitive analysis and pricing. We need a unified system that takes care of pricing decisions across all our properties. The biggest pain points are doing competitive analysis manually and then implementing pricing changes manually too.
5 Most Expensive Mistakes in RevPAR Calculation and Use
Mistake 1 - Using rooms sold instead of available rooms in the denominator.
This is actually computing ADR, not RevPAR. The mistake makes the number look better (higher) and removes the discipline of penalizing empty rooms. Properties tracking "RevPAR" this way are systematically over-stating performance and missing opportunities to fill empty inventory.
The fix: Always use total available rooms (Rooms × Days for the period), regardless of how many were actually sold. Rooms out of order count as available unless they’re removed from inventory for >30 days.
Mistake 2 - Reading RevPAR without decomposing into ADR × Occupancy.
RevPAR up by 5% looks the same whether it’s rate-driven, volume-driven, or compensating (rate up, volume down). The three patterns require opposite actions. Operators who only watch the top-line miss the diagnostic.
The fix: Always decompose. Use Formula 2 (ADR × Occupancy) on every weekly review. Pair with the 6 patterns table in this article: same RevPAR direction, opposite root causes.
Mistake 3 - Comparing RevPAR across periods of different length without normalizing.
A 28-day February has 8.6% fewer available room-nights than a 31-day March. RevPAR per night is the right comparison; total period RevPAR is misleading. The error compounds at the portfolio level when monthly RevPAR is averaged without weighting.
The fix: For period comparisons, always use Formula 3 (Total Revenue ÷ Room-Nights). For portfolio aggregation, weight by available room-nights, never by property count.
Mistake 4 - Optimizing RevPAR in isolation, ignoring TRevPAR and GOPPAR.
A property can grow RevPAR by 8% while GOPPAR drops 4% - e.g., when the lift comes from OTA-heavy promotions that increase channel cost faster than they grow revenue. RevPAR is a top-line metric; profitability requires the full stack.
The fix: Pair RevPAR with TRevPAR (total revenue per room) and GOPPAR (gross operating profit per room) on every owner report. The three together tell the complete story.
Mistake 5 - Setting RevPAR targets without comp set context.
"Grow RevPAR by 6%" is meaningless without comp set context. If the comp set grows 8% and you grow 6%, you’ve lost share. If the comp set is flat and you grow 6%, you’ve gained meaningfully. Absolute RevPAR targets miss this distinction.
The fix: Always set RevPAR targets in RGI (Revenue Generating Index) terms, not absolute terms. Target: "Grow RGI from 102 to 107 over 4 quarters" is a real, market-aware target. "Grow RevPAR by 6%" alone is not.
Conclusion - The Formula Is Easy. The Discipline Is Hard.
The RevPAR formula has been the same for 40 years: room revenue divided by available rooms. What separates top-quartile properties from median is not the formula - it’s the discipline of decomposing it, benchmarking it, and systematically improving it through compounding tactics. The 100-room property in our worked example moved from $142 to $165 RevPAR in 12 weeks not by finding one magic tactic, but by layering 5 modest ones (BAR optimization, length-of-stay fences, channel mix, event-day pricing, group displacement). Each lever was 2–5% on its own; together they compounded to +16.2%.
Three things make this discipline scale: (1) automated RevPAR calculation across the portfolio (so the numbers are current, not 30 days stale), (2) AI dynamic pricing (so BAR optimization runs continuously, not weekly), and (3) the connecting tissue between RevPAR / TRevPAR / GOPPAR / RGI that turns top-line tracking into full-picture decisions. Properties on RevEvolve see this stack delivered as a single workflow; properties without it run the same math manually with month-end visibility.
Booking pace tracking is manual, comp set rate shopping is manual, forecasting is basically educated guessing. Feel like I’m leaving money on the table by not having better tools for pricing decisions.
Run the formula. Decompose the result. Layer the tactics. Compound the lift.