QUICK ANSWER — An STR report is a hotel benchmarking report that compares your occupancy, ADR, and RevPAR against a competitive set you select, using anonymized data pooled from participating hotels. Its core output is three index scores — MPI (occupancy), ARI (rate), and RGI (RevPAR). An index of 100 means you captured exactly your fair share of the market; above 100 means you beat your comp set, below means you trailed it.
The report lands Wednesday morning. Your RGI is 95.7. Somebody in the ownership call is going to ask what that means, and “we’re slightly below our comp set” is not going to survive the follow-up question. Meanwhile your MPI says 108 — you’re filling more rooms than anyone around you. Two numbers, opposite stories, same hotel, same week.
That contradiction is the whole point of the report, and it’s where most teams stop reading. This guide covers what’s actually in an STR report, how the index math works, a worked example you can check your own numbers against, and the four misreads that turn good data into bad decisions.
I nodded through STAR report reviews for a year before I admitted I only understood about half of it. Nobody teaches you this — you’re just expected to know.
Key takeaways
- STR and STAR are used interchangeably. STR is the company (Smith Travel Research, now part of CoStar); STAR is the report it produces.
- Three raw metrics, three indices. Occupancy, ADR and RevPAR each get an index: MPI, ARI and RGI. Read them together or you will misdiagnose.
- 100 is fair share, not average. It means you captured exactly the share your room count entitles you to within the comp set.
- A high MPI with a low ARI usually means you bought occupancy with rate — the most common pattern in the report and the easiest to miss.
- The report is a scorecard, not a strategy. It tells you how last week went, after the window to price it has already closed.
What Is an STR Report?
The mechanics are a data trade. You submit your own performance figures to STR; STR anonymizes and aggregates them with everyone else’s in your market and sends back a report showing exactly where you stand. No individual competitor’s numbers are ever exposed to you, and yours are never exposed to them — you only see the comp set in aggregate.
A quick naming note, because it trips people up constantly. STR stands for Smith Travel Research, the company (now part of CoStar Group). STAR stands for Smith Travel Accommodations Report, the report itself. In practice hoteliers use “STR report” and “STAR report” to mean the same thing, and nobody corrects them. Neither has anything to do with star ratings or guest satisfaction — this is purely operational performance.
Reports typically arrive weekly, with monthly and annual versions available. Revenue managers track them week to week, GMs use them for pricing conversations, and owners, asset managers, and lenders use them to judge whether the asset is performing.
What’s Actually in the Report
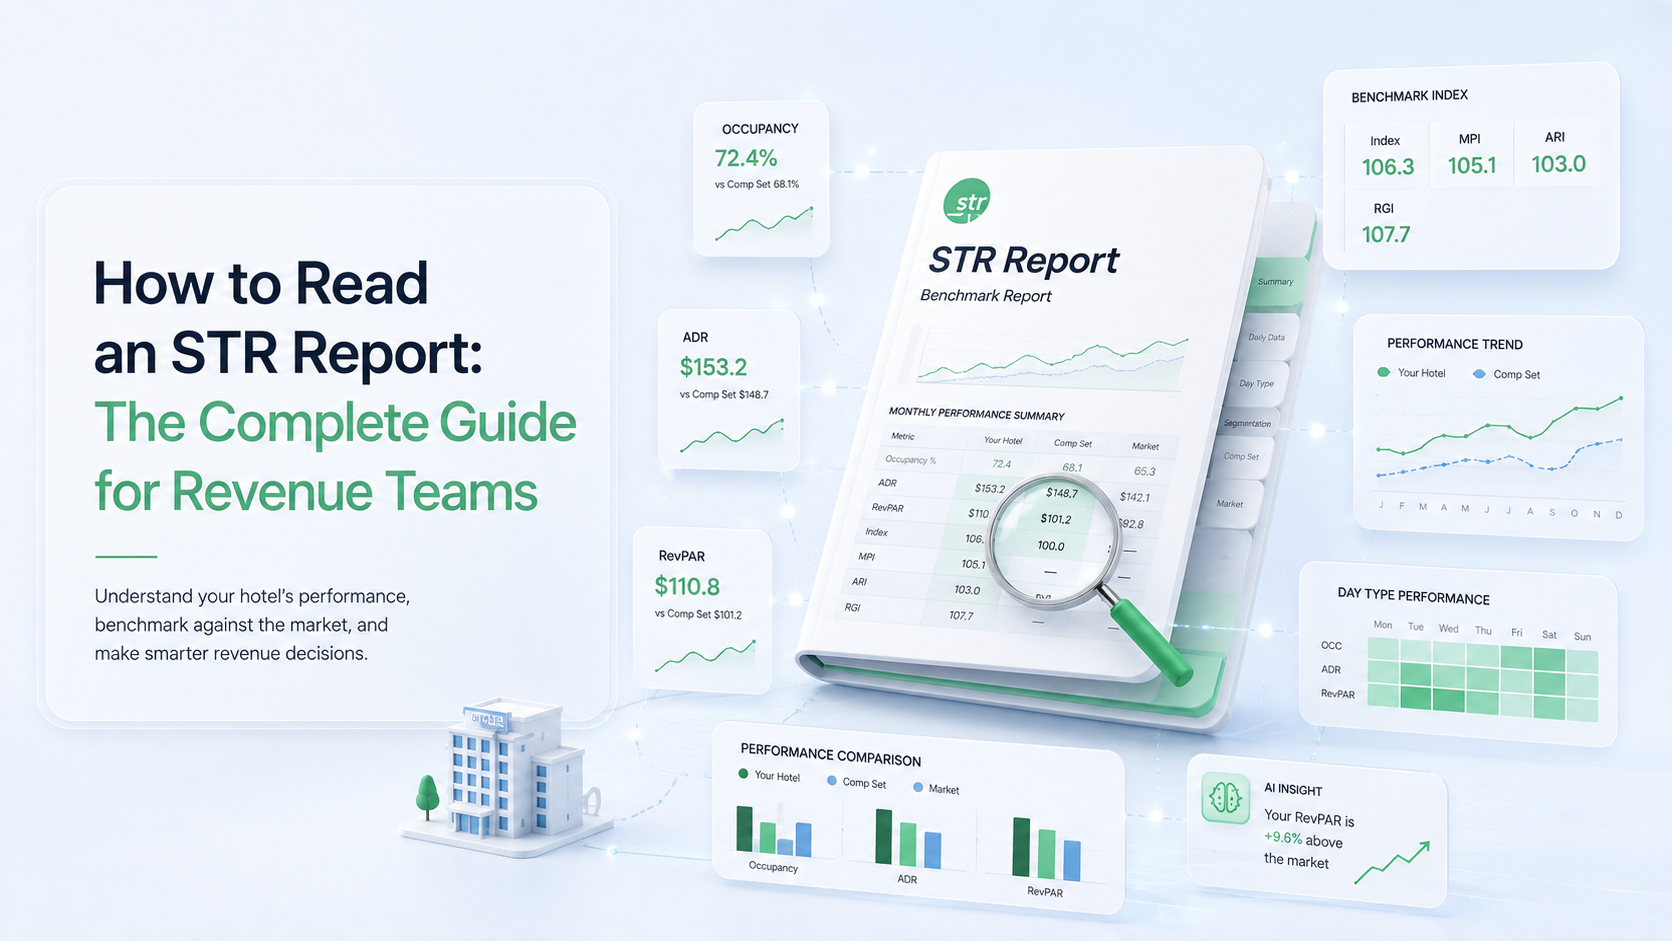
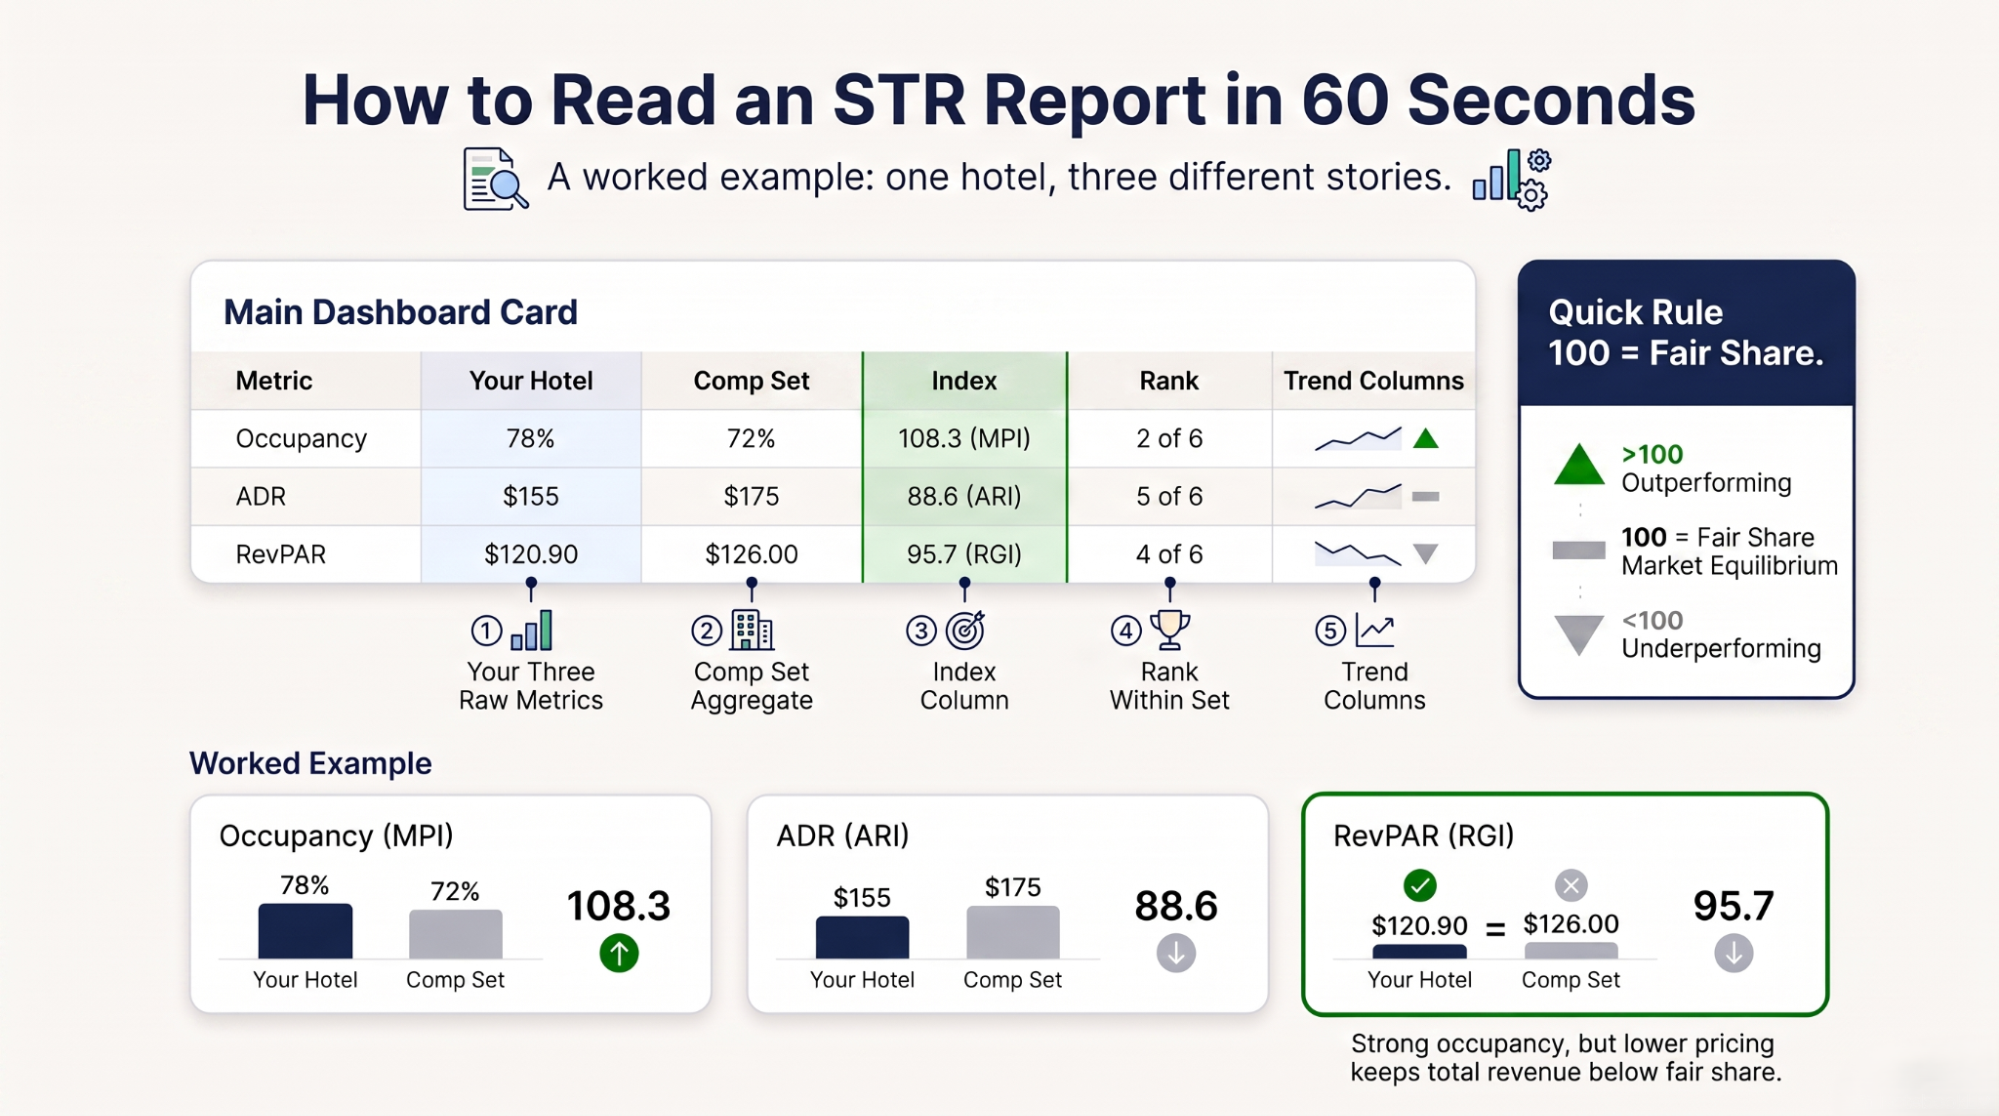
The layout varies by subscription, but the working set is consistent. Four things you’ll use:
1 · Your three raw metrics
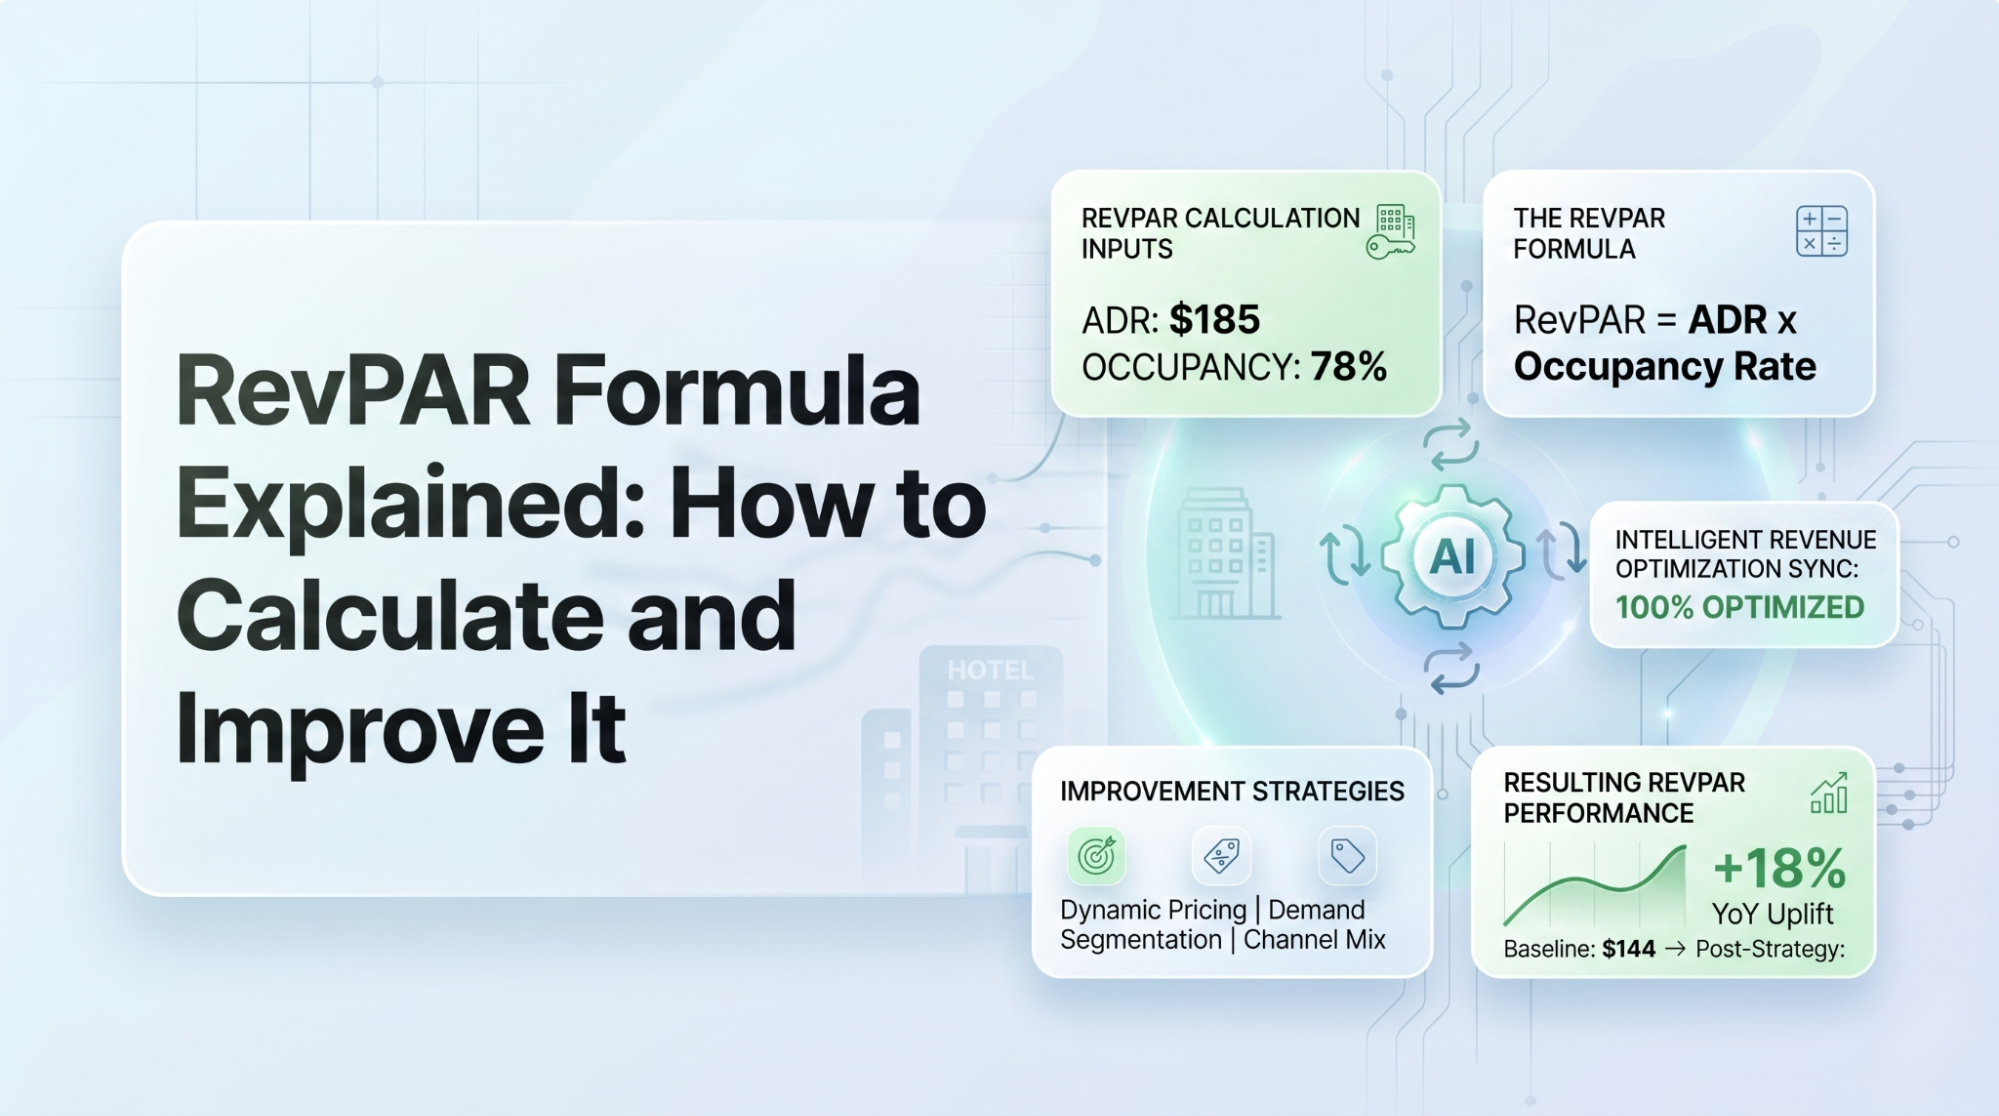
Occupancy, ADR, and RevPAR for your property, across the current period, year-to-date, and rolling 3- and 12-month windows. If the formulas aren’t second nature yet, start with the RevPAR formula.
2 · The same three for your comp set
The aggregated performance of the hotels you selected for comparison — never broken out by individual property.
3 · Three index scores
MPI, ARI, and RGI: your metric divided by your comp set’s, multiplied by 100. This is where the actual insight lives.
4 · Rank and trend
Where you sit within the comp set, and how the picture has moved over the trailing periods. A single week is noise; the trend is the signal.
The Index Math: What 100 Actually Means
Every index in the report is the same calculation. Your number, divided by your comp set’s number, times 100.
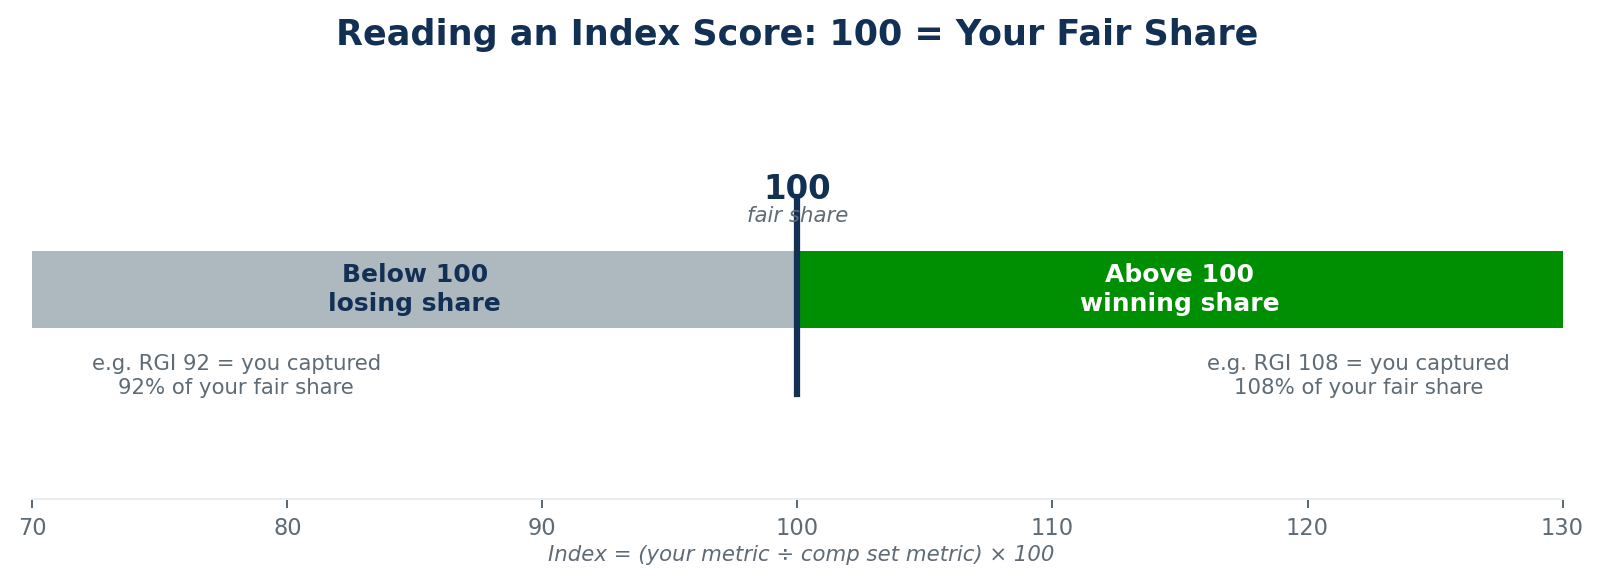
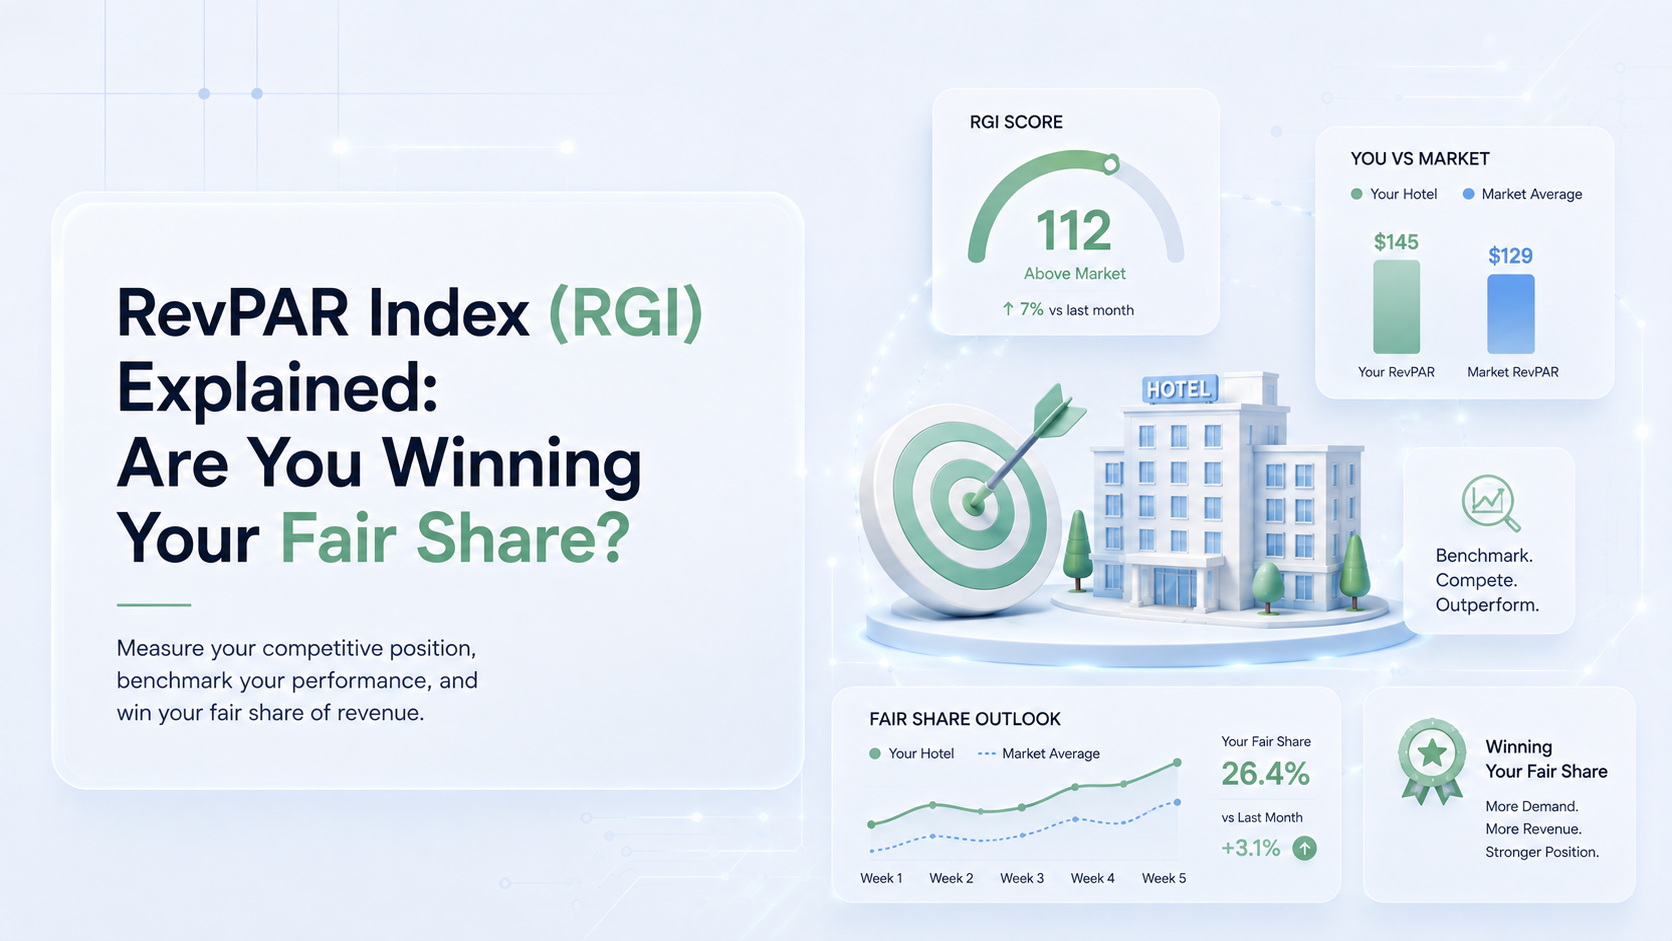
“Fair share” is the concept people skip past, and it matters. If your hotel is 100 rooms in a comp set totalling 500 rooms, your fair share of the market’s occupied rooms is 20%. Capture exactly 20% and your MPI is 100. Capture 22% and it’s 110. It isn’t a grade against an average — it’s a measure of whether you pulled your weight.
| Index | Full name | What it measures | Formula |
|---|---|---|---|
| MPI | Market Penetration Index | Occupancy share — are you filling more rooms than your share? | (your Occ ÷ comp set Occ) × 100 |
| ARI | Average Rate Index | Rate position — are you charging more or less than the set? | (your ADR ÷ comp set ADR) × 100 |
| RGI | Revenue Generation Index | Revenue share — the one that actually counts | (your RevPAR ÷ comp set RevPAR) × 100 |
A Worked Example: One Hotel, Three Different Stories
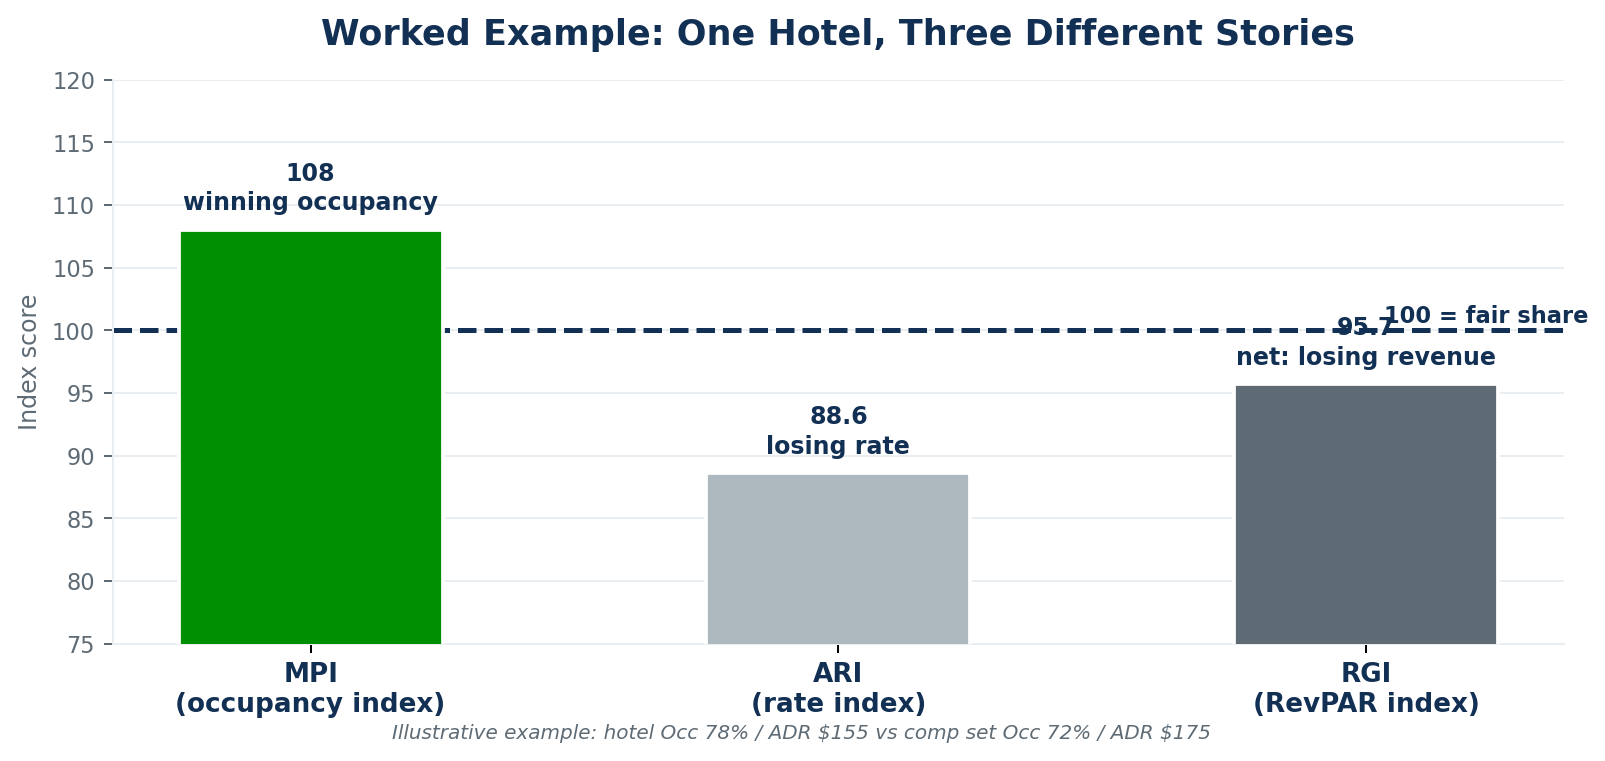
Take a property running 78% occupancy at a $155 ADR. Its comp set is running 72% occupancy at a $175 ADR. Same week, same market. Here is what the report says.
| Your hotel | Comp set | Index | |
|---|---|---|---|
| Occupancy | 78% | 72% | MPI 108.3 |
| ADR | $155 | $175 | ARI 88.6 |
| RevPAR | $120.90 | $126.00 | RGI 95.7 |
Read only the MPI and you’d conclude the hotel is winning — it’s filling more rooms than its share. Read only the ARI and you’d conclude it’s cheap. Read the RGI and you get the truth: it bought that occupancy with rate, and the trade lost money. Every $1 of RevPAR below the set, across 100 rooms and 365 nights, is real. Here it’s about $5.10 a night, or roughly $186,000 a year.
The fix isn’t automatically “raise rate.” It depends on whether demand supports it on those specific dates — which the report can’t tell you, because it’s looking backward. More on that below, and on the profit picture in our GOPPAR guide.
The Four Ways Teams Misread the Report
The data is reliable. The reading is where it goes wrong — and these four errors are close to universal.
1 · Reading RGI alone
RGI is the headline, so it gets quoted in isolation. But RGI 96 caused by a rate problem and RGI 96 caused by an occupancy problem call for opposite responses. Without MPI and ARI beside it, you know you have a problem and nothing about which one.
2 · Treating one week as a trend
A single week swings on a group block, a maintenance closure, or one competitor’s renovation. Weekly numbers are noisy by nature. Judge the rolling 3-month and 12-month columns; use the week only to spot something worth investigating.
3 · Trusting a comp set that’s drifted
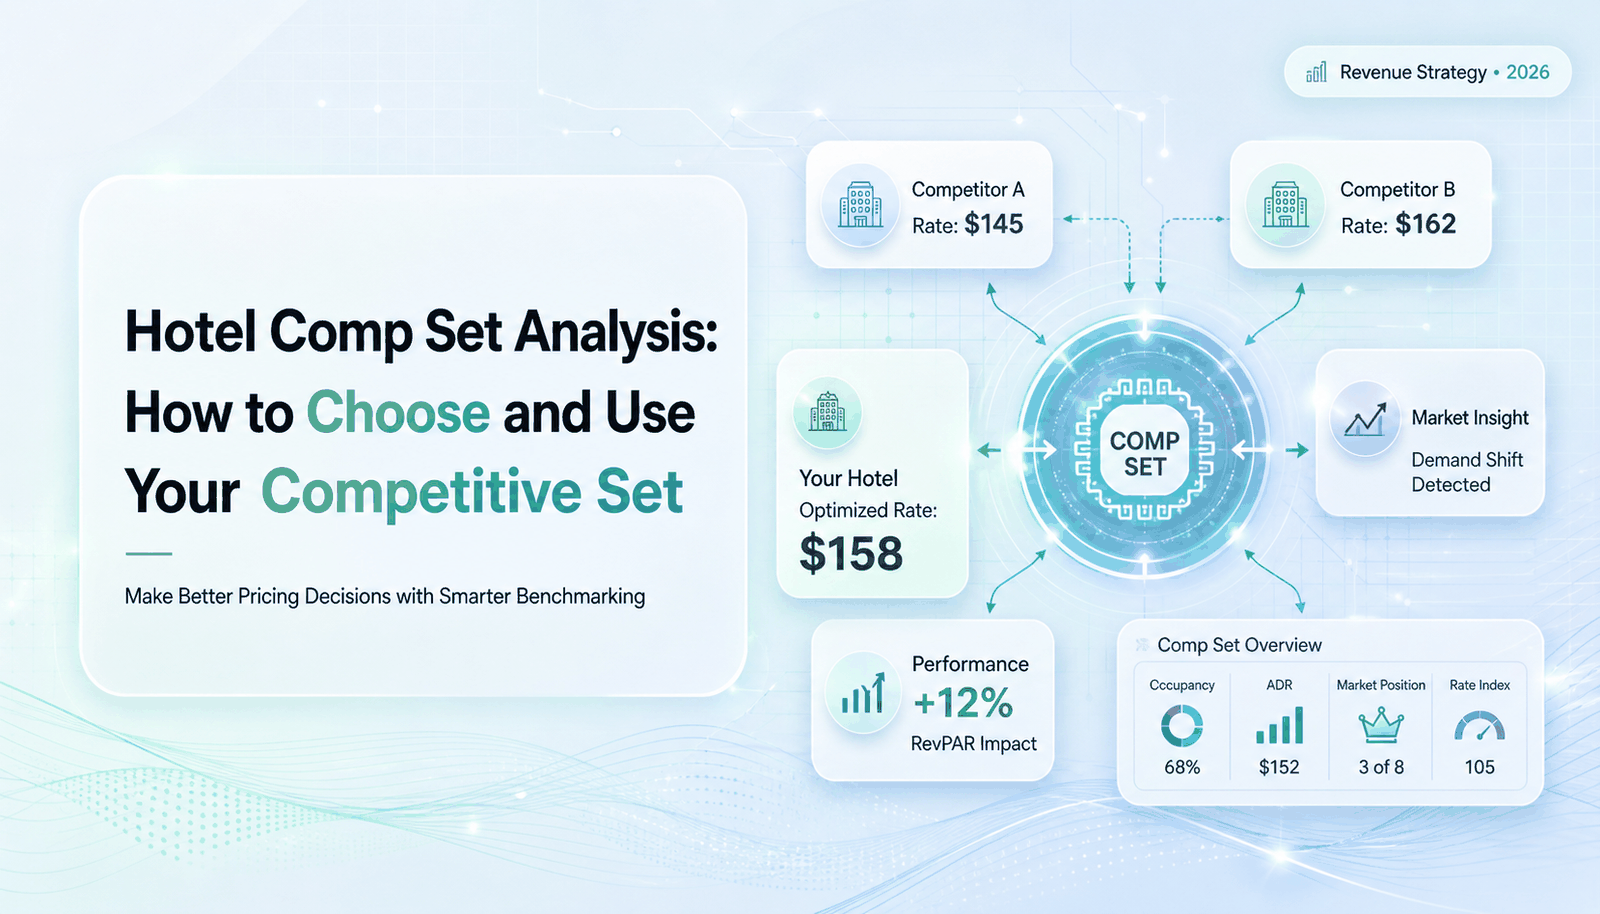
Every index is calculated against your comp set, so if the set is wrong, every number in the report is wrong — confidently and to two decimal places. Comp sets drift as hotels renovate, reposition, or open nearby. If yours hasn’t been reviewed in two years, the whole report is measuring you against a market that no longer exists. Our guide on building a comp set that isn’t built on ego covers how to fix it.
4 · Mistaking the scorecard for the strategy
The biggest one, and the subject of the next section.
The Report’s Real Limitation: It Arrives After the Decision
STR data is historical. It tells you, accurately and in detail, what already happened. But the decision that produced those numbers — what to charge on a given date — had to be made days or weeks before the date arrived.
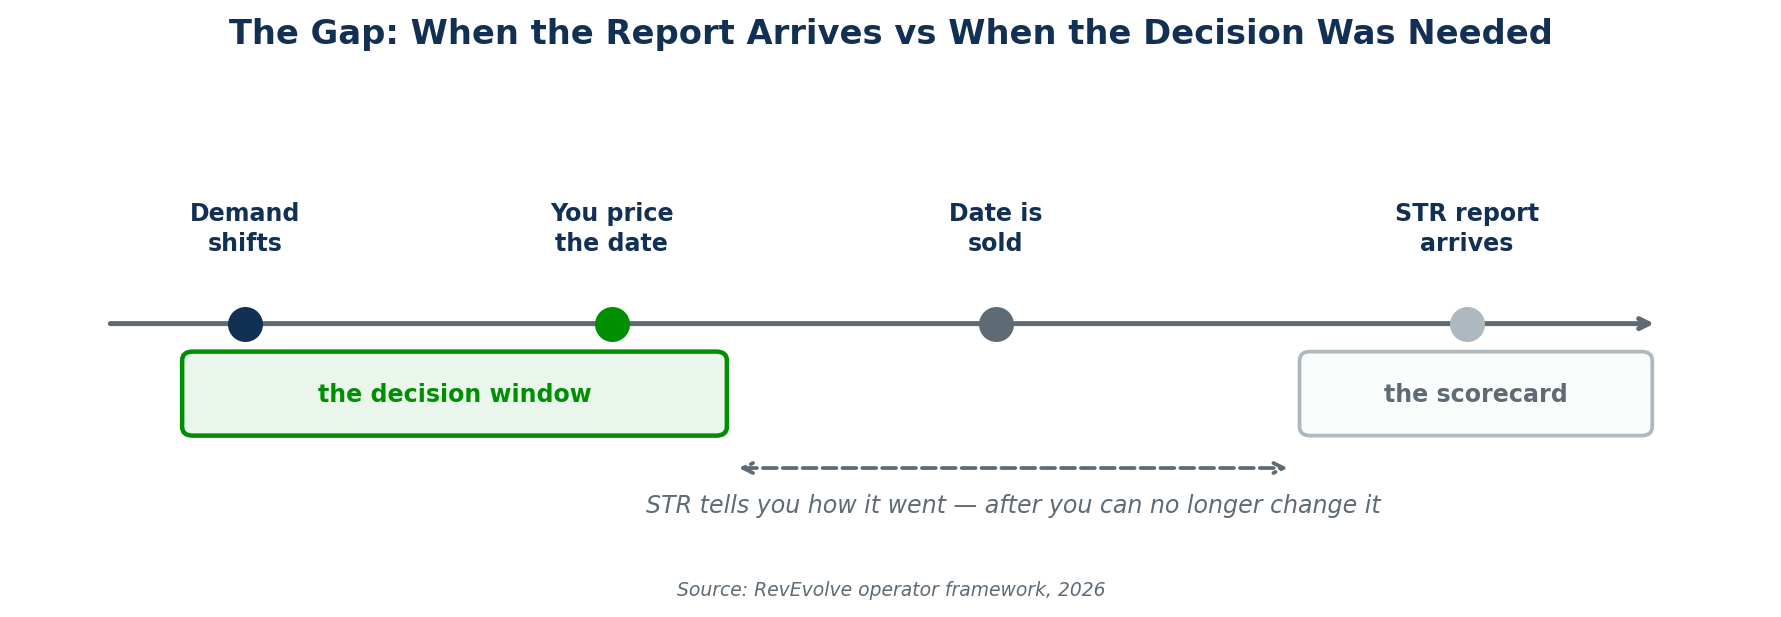
By the time an RGI of 95.7 lands in your inbox, those room nights are sold. You can learn from it and adjust next month’s approach, and you should. What you can’t do is reprice the week it describes.
This isn’t a criticism of the report — benchmarking is exactly what it’s built for, and nothing else does it as credibly. It’s a statement about what benchmarking is: measurement, not decision support. You need both, and they’re different tools.
That forward half is where a revenue system works. RM Copilot analyzes demand across your own PMS data, recommends the rate with the reasoning attached, and lets you simulate the impact before you commit — your team reviews and applies the decision. Then next week’s STR report tells you how the call went. One tool sets the number; the other grades it.
Worth separating two categories people conflate here: some hospitality AI is guest-facing — chat and messaging that help you talk to travelers. RM Copilot is operator-facing: it works with your revenue team on the pricing decision itself.
How to Actually Use the Report Each Week
A workable routine, in the order that keeps you from jumping to conclusions:
- Read all three indices together, always. MPI and ARI first, then RGI as the verdict. Never quote RGI on its own.
- Check the rolling columns before reacting. If the 3-month trend disagrees with the week, believe the trend.
- Diagnose before prescribing. Rate problem or occupancy problem? The answer determines the response entirely.
- Segment the miss. Which days of week, which dates? A weekday-only gap is a corporate story; a weekend gap is a leisure or events story.
- Re-validate the comp set annually. Put a recurring reminder on it. Drift is silent.
- Carry one decision out of every review. A report that produces no forward action is a meeting, not a tool.
Questions That Come Up in the Revenue Meeting
Keep going: Hotel comp set analysis · RevPAR formula explained · What is GOPPAR? · Revenue management glossary.