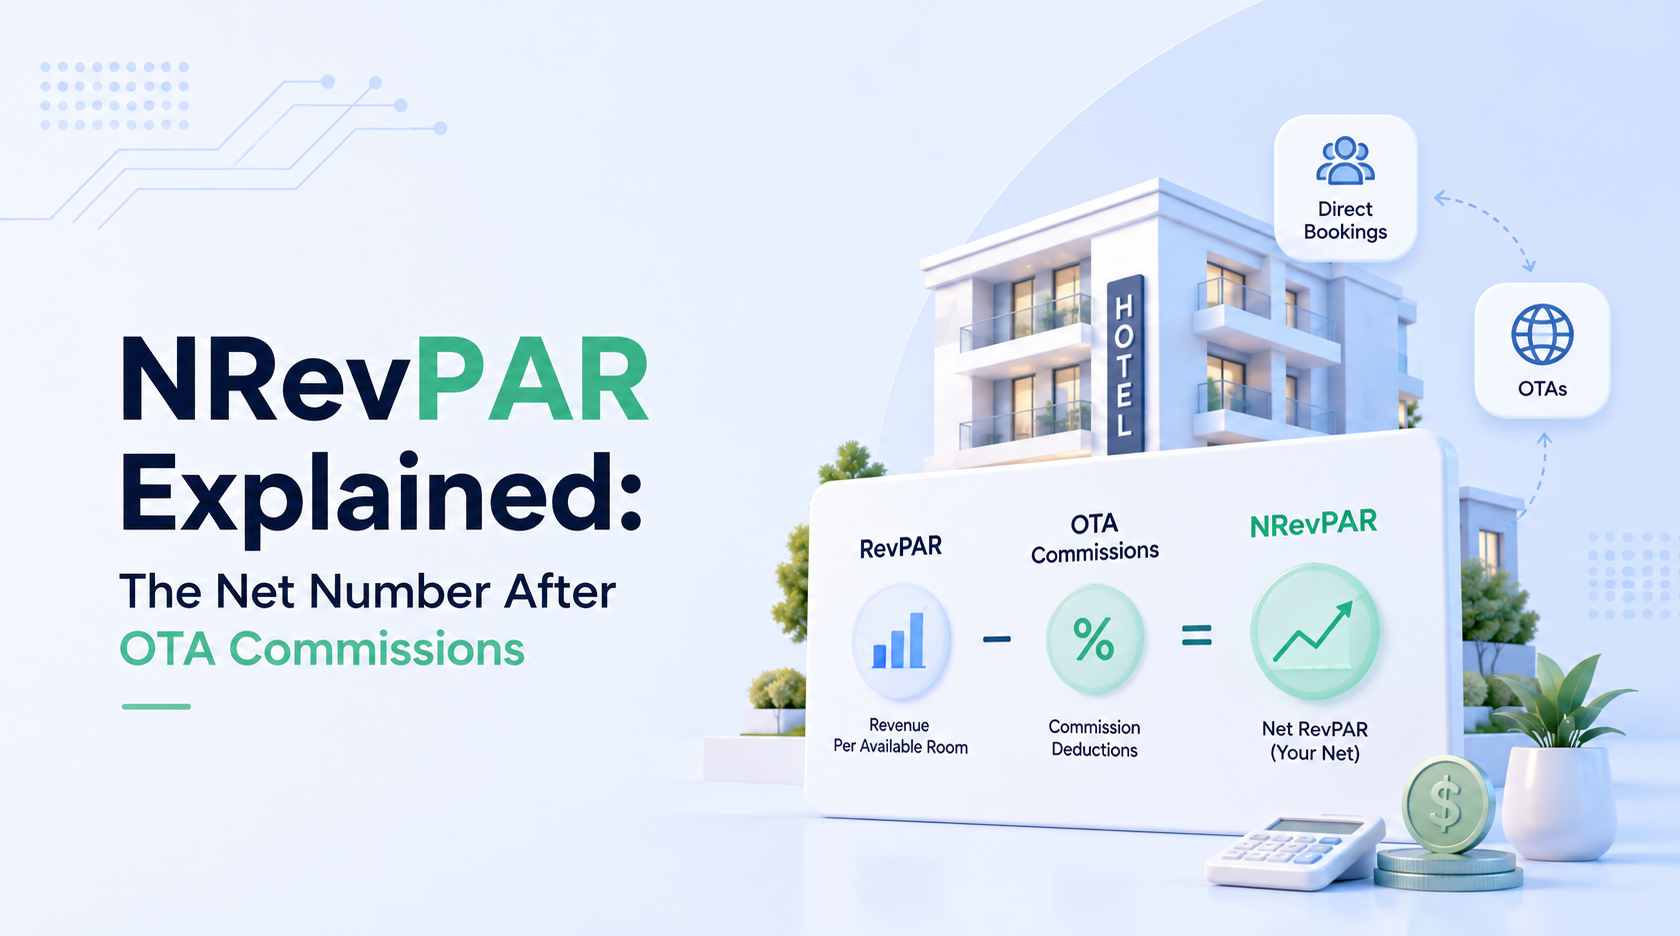
SNIPPET DEFINITION — NRevPAR (net revenue per available room) is total room revenue minus distribution costs — OTA commissions, transaction fees, and loyalty or discount costs — divided by the number of available rooms. It shows what each available room earns after the cost of selling it, so two hotels with identical RevPAR can post very different NRevPAR based on channel mix.
Your monthly report says RevPAR is up 9%. Ownership is happy. Then finance runs the net numbers and the smile fades: after OTA commissions, payment fees, and loyalty discounts, what the hotel actually kept barely moved. The RevPAR win was real — it just wasn’t yours to keep.
That gap has a name. NRevPAR is the number that shows what a room actually earns after the cost of selling it. If RevPAR is the headline, NRevPAR is the bank balance.
Our RevPAR looks great, but after the OTAs take their cut, the net is a completely different story. Ownership only ever asks about RevPAR.
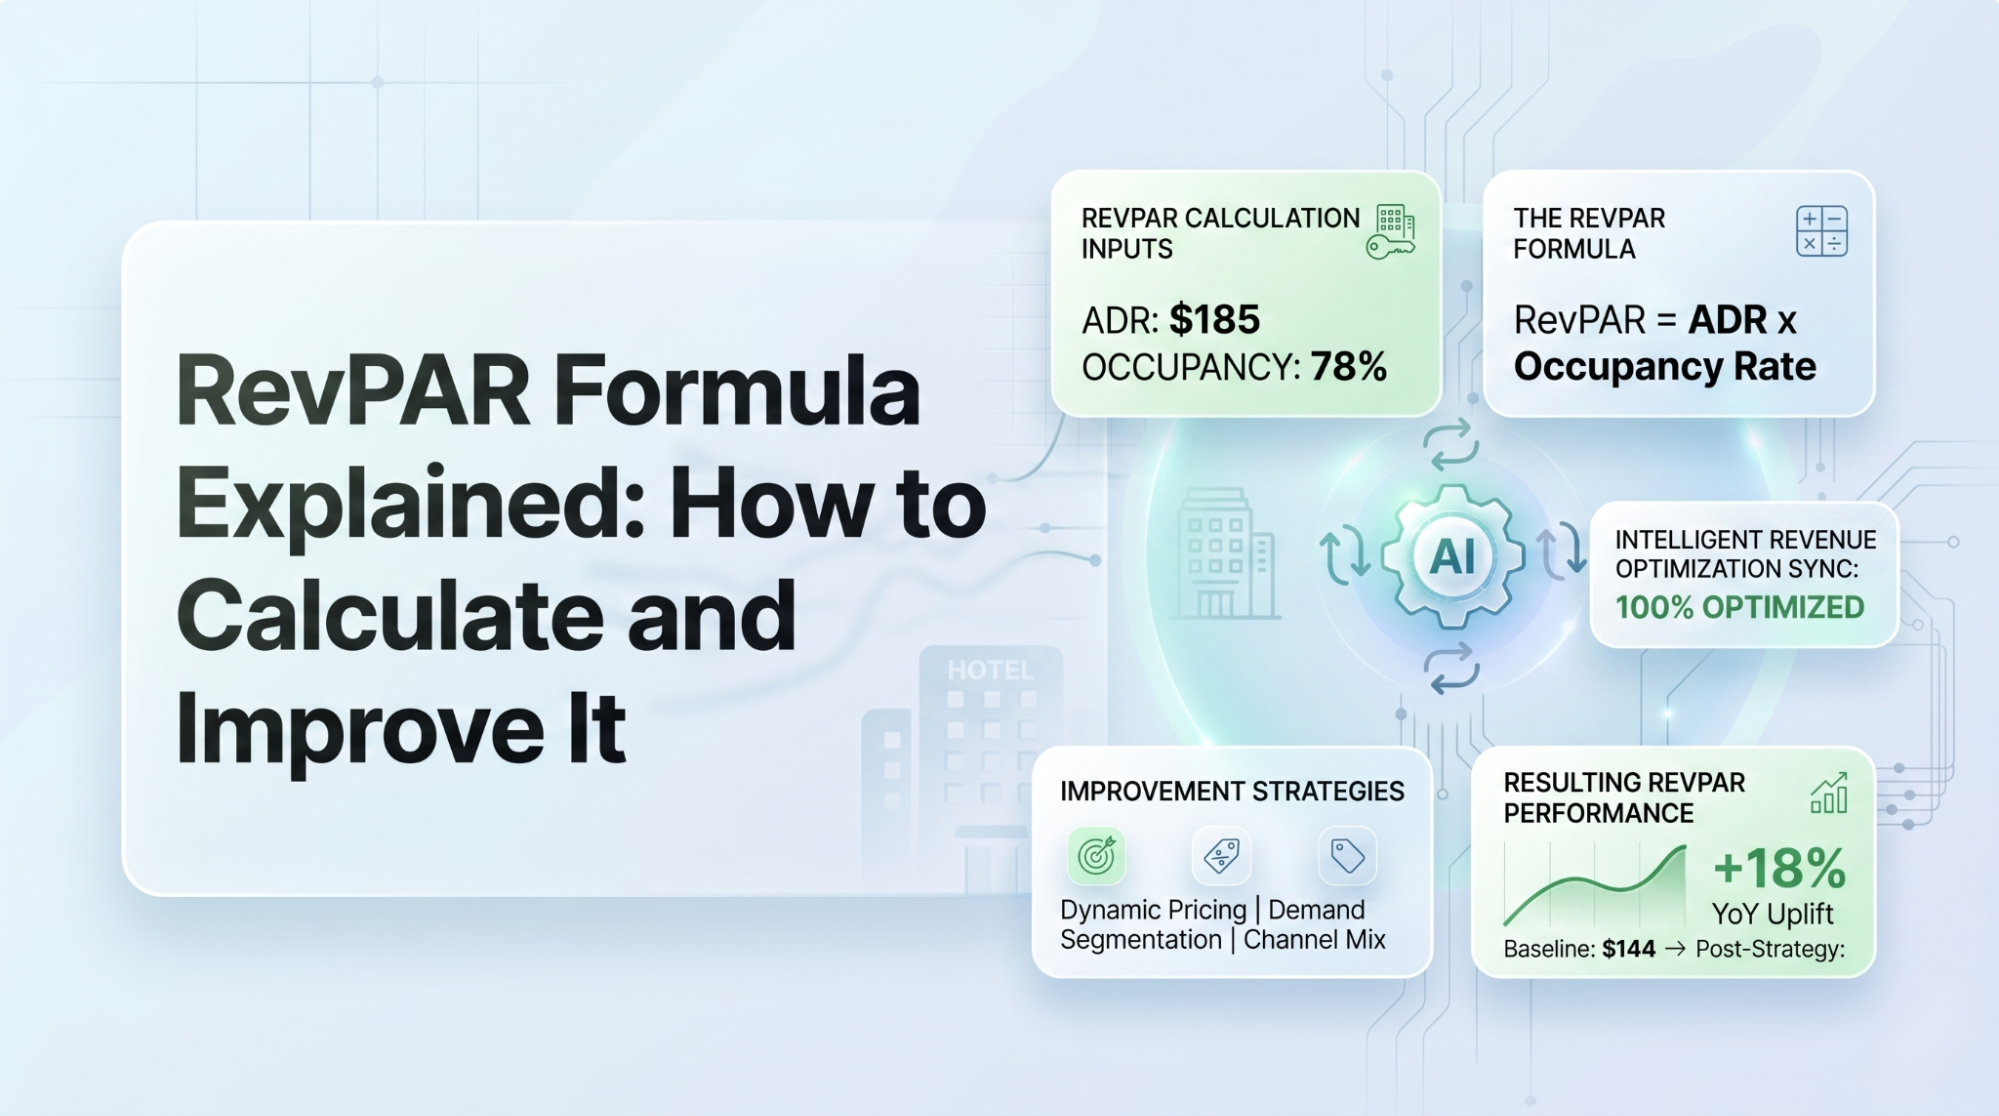
Quick scope note: this post is about NRevPAR, the net metric. If you want the base formula for the gross number, see how RevPAR is calculated. NRevPAR starts where RevPAR ends — by subtracting the cost of distribution. It sits alongside RevPAR in your hotel KPI stack, not on top of it.
Key takeaways
- NRevPAR = (room revenue − distribution costs) ÷ available rooms.
- RevPAR is gross; NRevPAR is what you keep after commissions.
- OTA commissions of 15–25% are the biggest line in the gap.
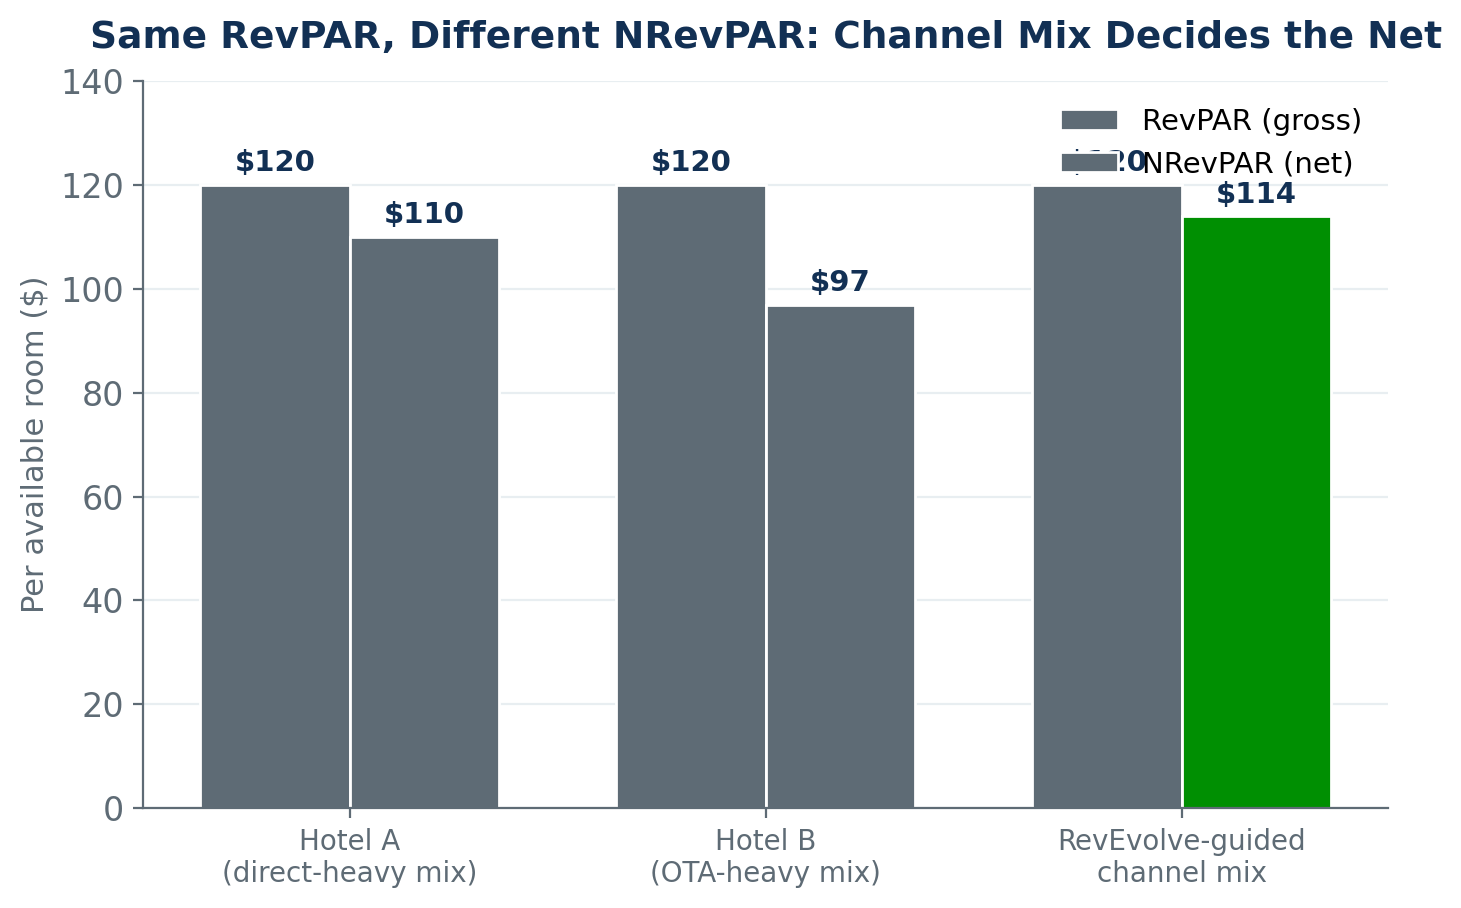
- Same RevPAR + different channel mix = different NRevPAR.
- Track both, or you’ll optimize revenue you don’t get to keep.
What is NRevPAR?
RevPAR answers “how much revenue did each room generate?” NRevPAR answers a sharper question: “how much of that did we actually keep?” For a distribution-heavy hotel, the difference between those two answers is the whole game.
NRevPAR vs RevPAR: what’s the difference?
RevPAR is gross. It multiplies occupancy by average daily rate and ignores what it cost to fill the room. NRevPAR is net. It strips out the commissions and fees baked into each booking, so the number reflects channel efficiency, not just demand.
| Dimension | RevPAR | NRevPAR |
|---|---|---|
| What it measures | Gross revenue per available room | Net revenue per available room |
| Includes distribution cost? | No | Yes — subtracts it |
| Formula | Room revenue ÷ available rooms | (Room revenue − distribution cost) ÷ available rooms |
| What it rewards | Filling rooms | Filling rooms cheaply (channel mix) |
| Best read with | ADR, occupancy | RevPAR, GOPPAR, cost of sale |
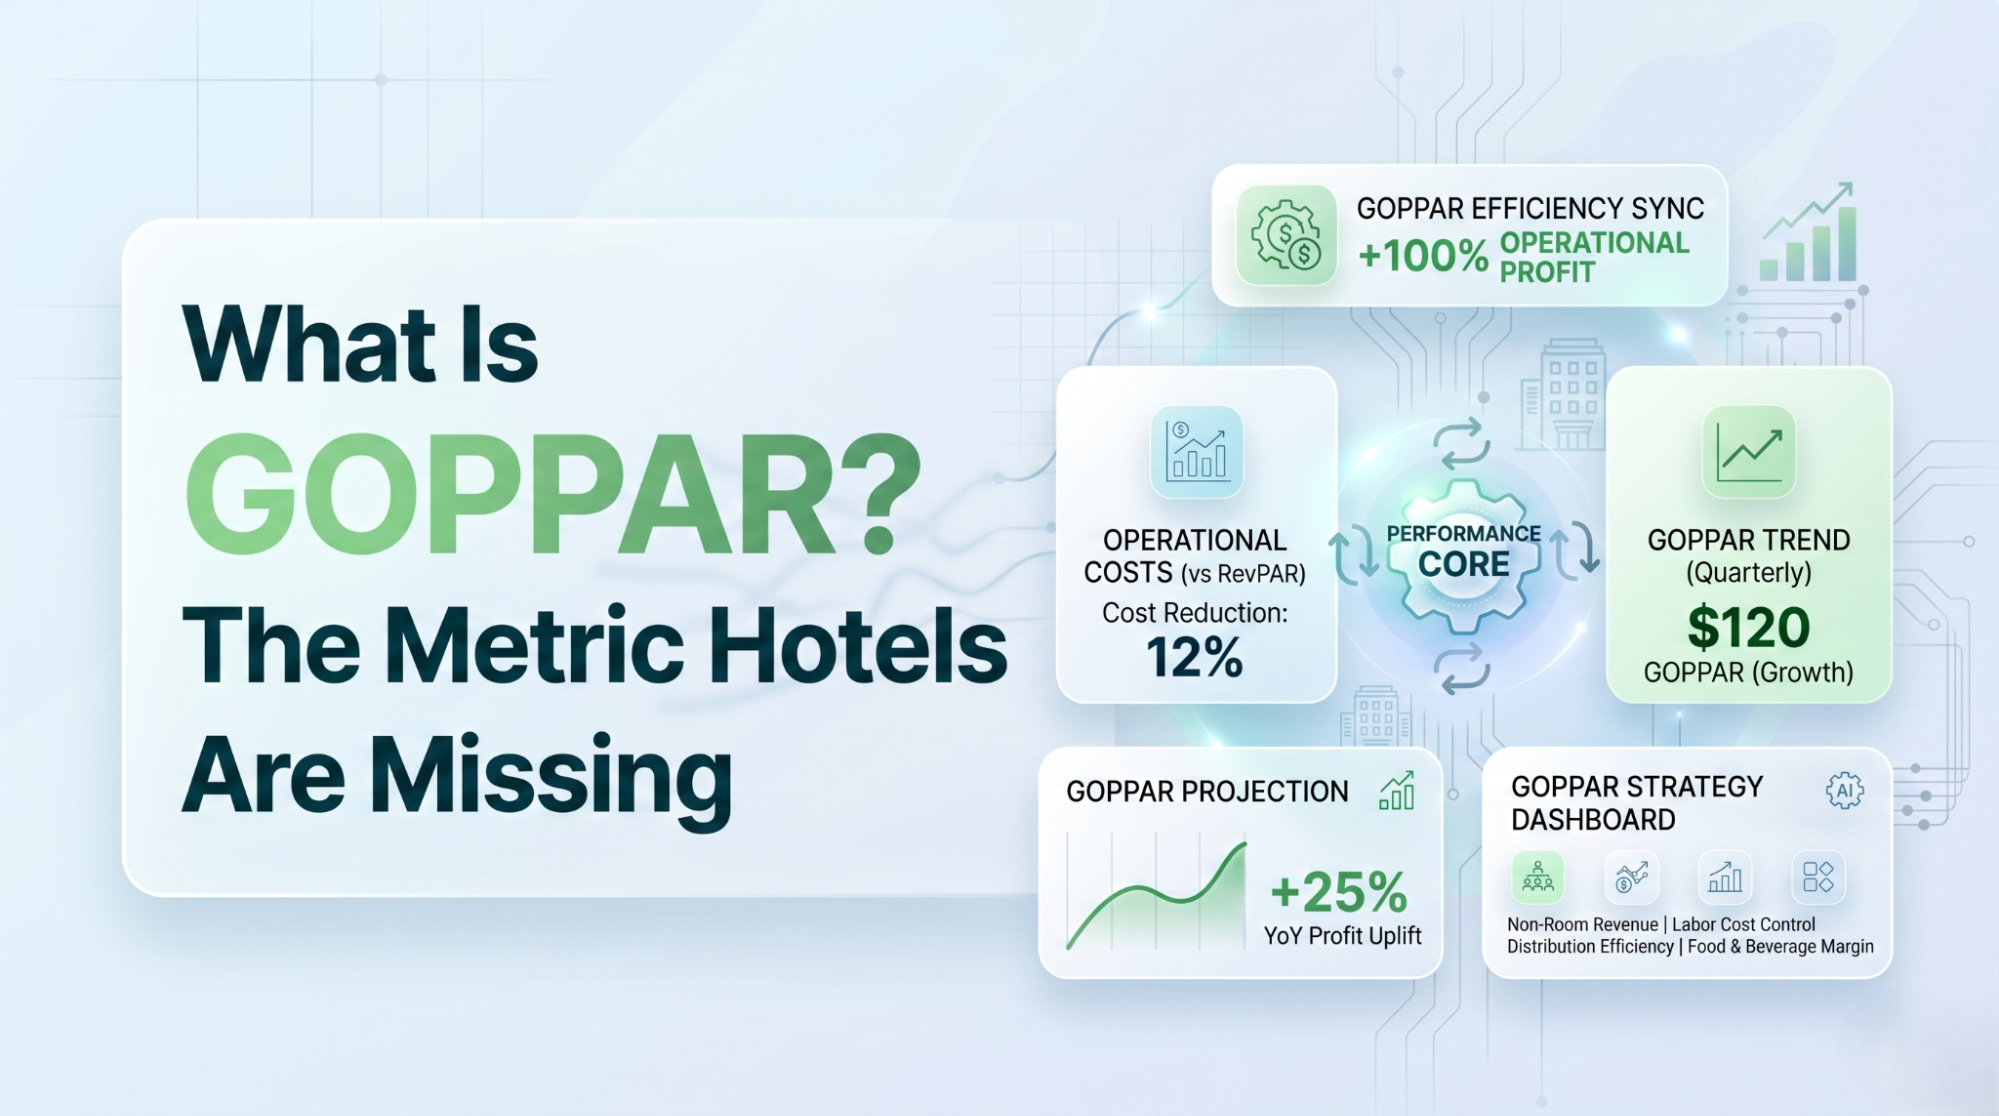
Read them together. Then read both against profit with GOPPAR, which takes the next step and subtracts operating costs, not just distribution costs.
How do you calculate NRevPAR?
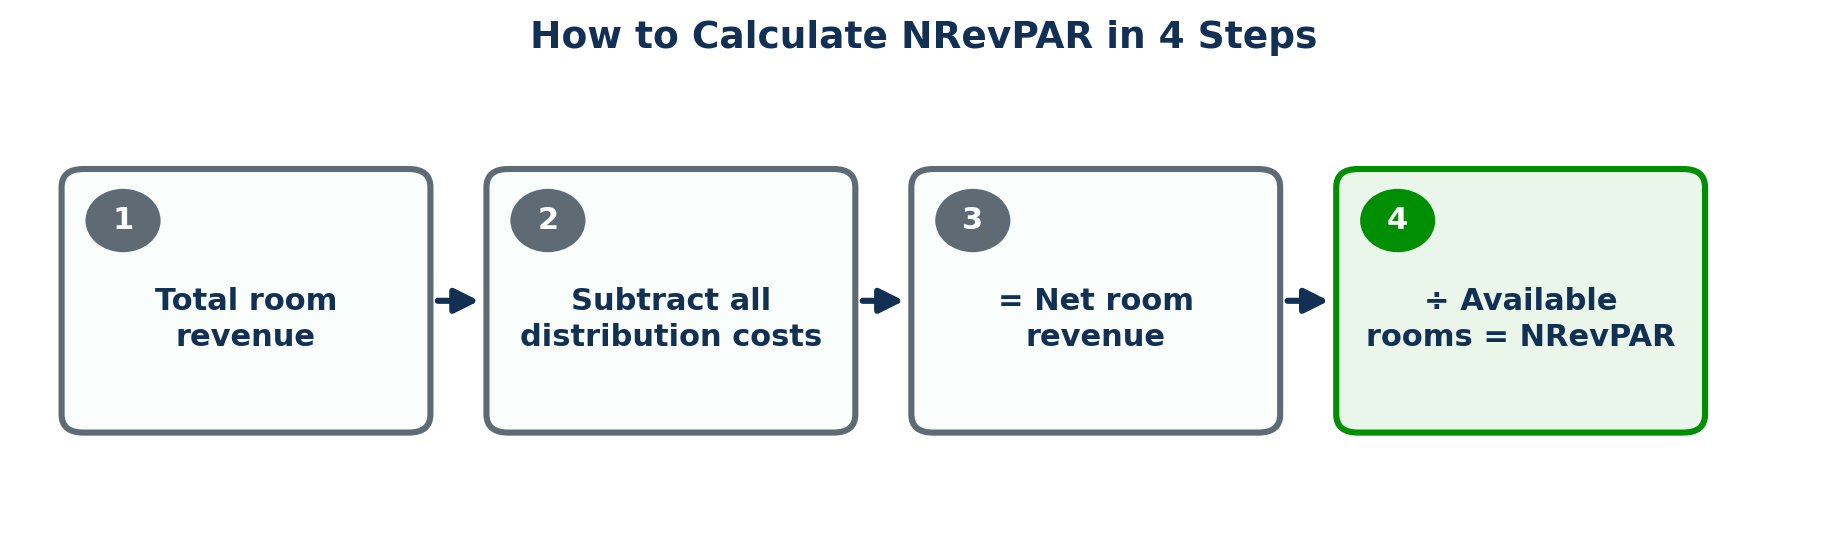
Calculating NRevPAR takes four steps. The only new input beyond RevPAR is your distribution cost — the commissions and fees attached to the bookings in the period.
- Total your room revenue for the period.
- Subtract all distribution costs (OTA commissions, transaction/payment fees, loyalty and discount costs).
- The result is your net room revenue.
- Divide net room revenue by the number of available rooms (room nights) to get NRevPAR.
A worked example
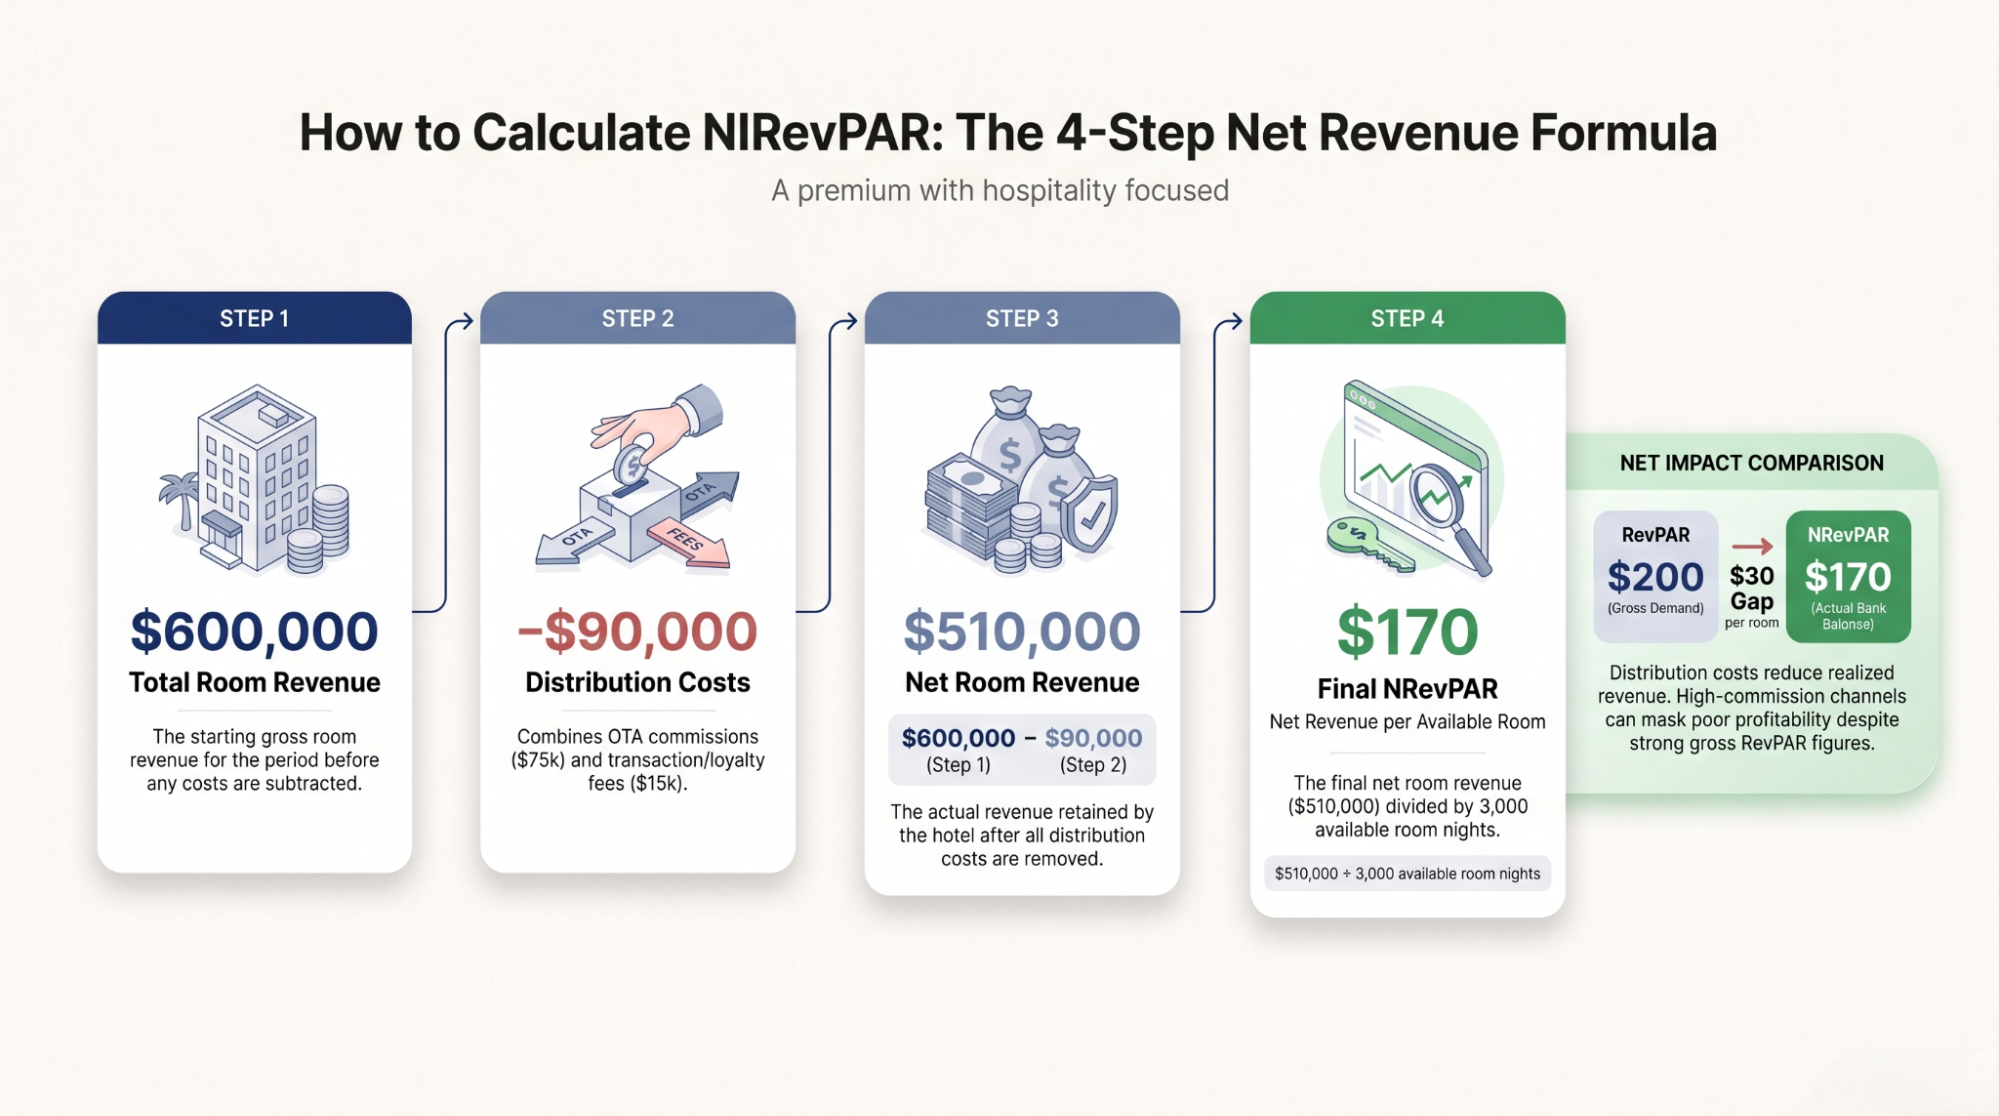
A 100-room hotel books $600,000 in room revenue over 30 days (3,000 available room nights). RevPAR is $600,000 ÷ 3,000 = $200. Now subtract distribution costs: $75,000 in OTA commissions and $15,000 in fees and loyalty discounts, for $90,000. Net room revenue is $510,000. NRevPAR is $510,000 ÷ 3,000 = $170.
What counts as a distribution cost?
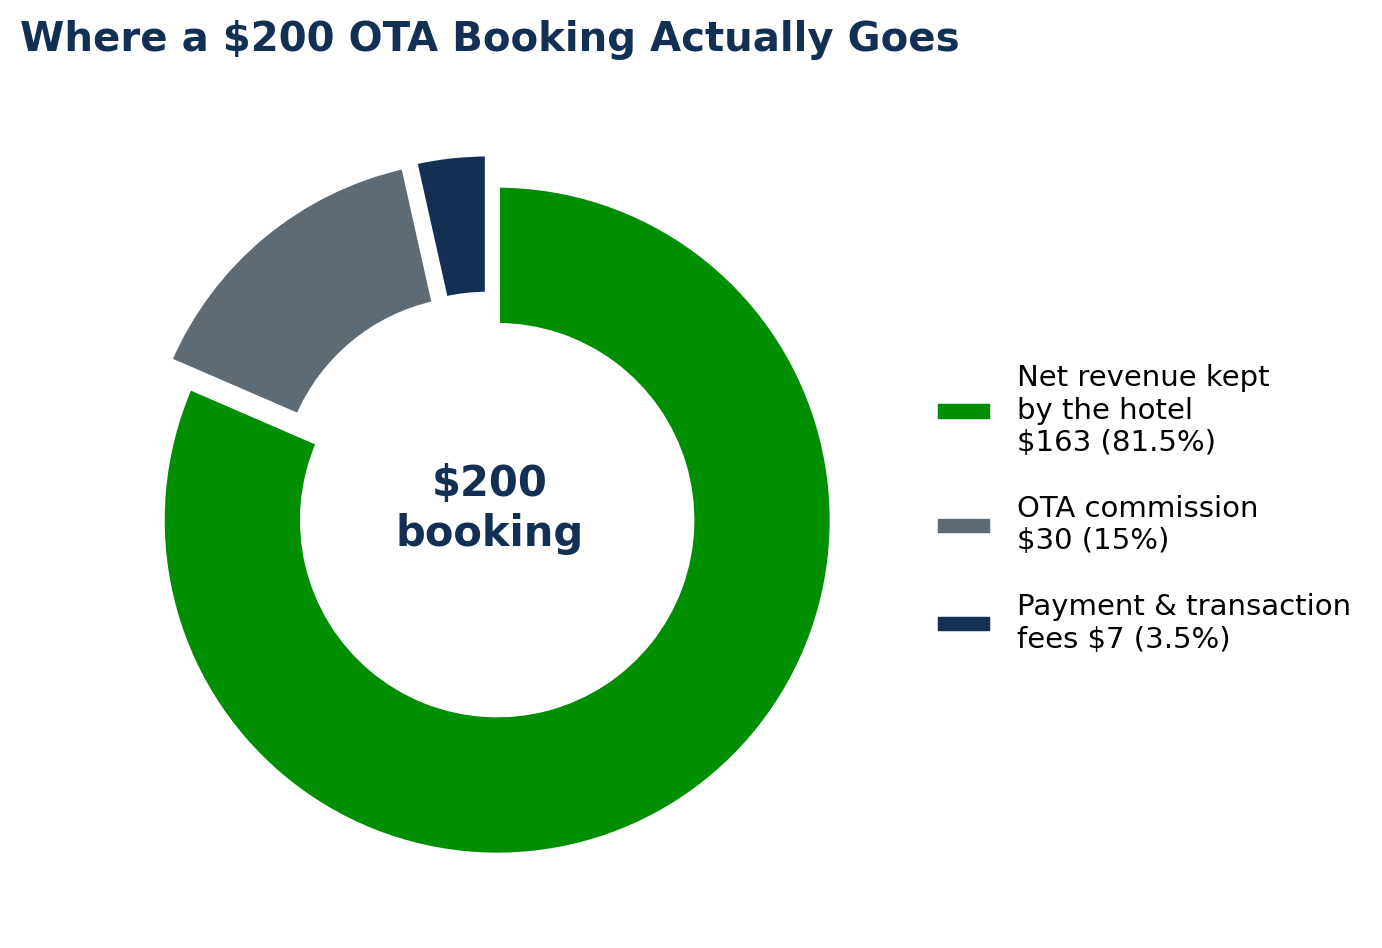
Distribution cost is the total cost of getting a booking through a channel. For most hotels the biggest piece is OTA commission, but it isn’t the only one. If you want the full map of how bookings arrive, see hotel distribution channels. For NRevPAR, include every cost tied to selling the room:
- OTA commissions — typically 15–25% of booking value.
- Payment and transaction fees — card processing, virtual-card fees.
- Loyalty and discount costs — member rates, promo codes, package concessions.
- Travel-agent / GDS commissions — where applicable.
Direct bookings still carry cost — marketing, booking-engine fees — but the cost of sale is usually far lower than OTA. That is why channel mix moves NRevPAR so much: shifting demand from a 20% channel to a 5% channel lifts the net without adding a single room night.
Where NRevPAR tracking goes wrong
NRevPAR is simple math, but the inputs trip hotels up. These are the failure modes that make the number lie.
1 · Counting the wrong costs
Some teams subtract only OTA commission and forget fees and loyalty discounts. Others subtract operating costs and accidentally build GOPPAR instead. NRevPAR is net of distribution cost only — nothing more, nothing less.
2 · Blending channels into one blended rate
A single blended commission rate hides the mix. If you can’t see NRevPAR by channel, you can’t see which channels are quietly bleeding the net.
3 · Reporting RevPAR without NRevPAR
The most common failure is not tracking it at all. A KPI deck with RevPAR and no NRevPAR optimizes for volume the hotel may not keep.
Where NRevPAR actually pays off
NRevPAR earns its place on the deck in four situations where RevPAR alone points the wrong way.
- Channel-shift decisions — proving a direct-booking push adds net, not just gross.
- OTA negotiations — quantifying what a commission point actually costs per available room.
- Portfolio comparison — ranking properties by what they keep, not just what they sell.
- Promotion sign-off — checking a discount or package still clears a healthy net.
Case study: distribution discipline at Comfort Inn Festus
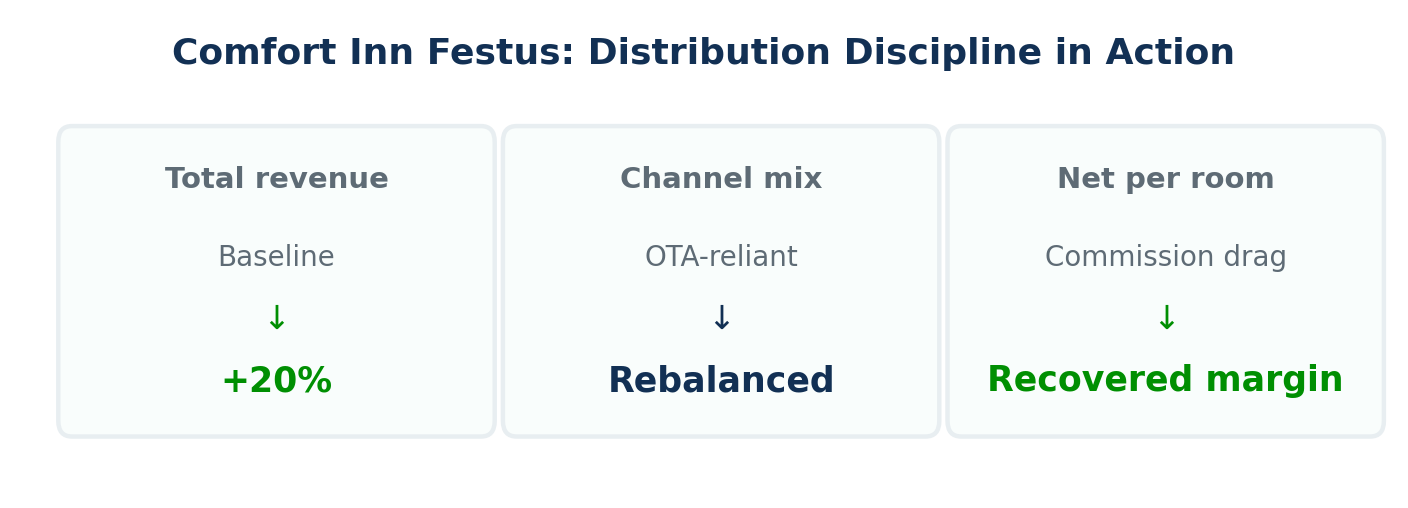
Comfort Inn Festus grew total revenue by 20% by treating distribution as a lever, not a fixed cost. The work wasn’t exotic: rebalance the channel mix toward lower-cost demand, watch the net move, and hold rate discipline where OTA volume was eroding it. RevPAR and NRevPAR rose together — the point of tracking the net is to make sure they do.
How RevEvolve helps you protect net RevPAR
RM Copilot is an operator-facing AI revenue copilot. It analyzes performance, surfaces opportunities, simulates outcomes, and recommends pricing and channel actions with the reasoning attached — then your team reviews and applies them. It does not auto-publish rates or push to your PMS, CRS, or OTAs. You keep control of every decision.
For NRevPAR specifically, the What-If Simulator can show the projected net impact of shifting demand between channels before you commit, so a channel move that helps RevPAR but hurts the net gets caught on screen, not in next month’s report.
NRevPAR: three common objections
The number worth keeping
RevPAR tells you the room sold. NRevPAR tells you what the sale was worth. For a hotel leaning on OTAs, the space between those two numbers is the cost of distribution — and it’s the most controllable line most decks ignore.
Put NRevPAR next to RevPAR. Break it out by channel. Then the channel-mix decision stops being a guess and becomes a number you can defend to ownership. That’s the whole point: optimize the revenue you actually keep.
Keep going: RevPAR formula explained · What is GOPPAR? · Hotel distribution channels · The 20 hotel KPIs.