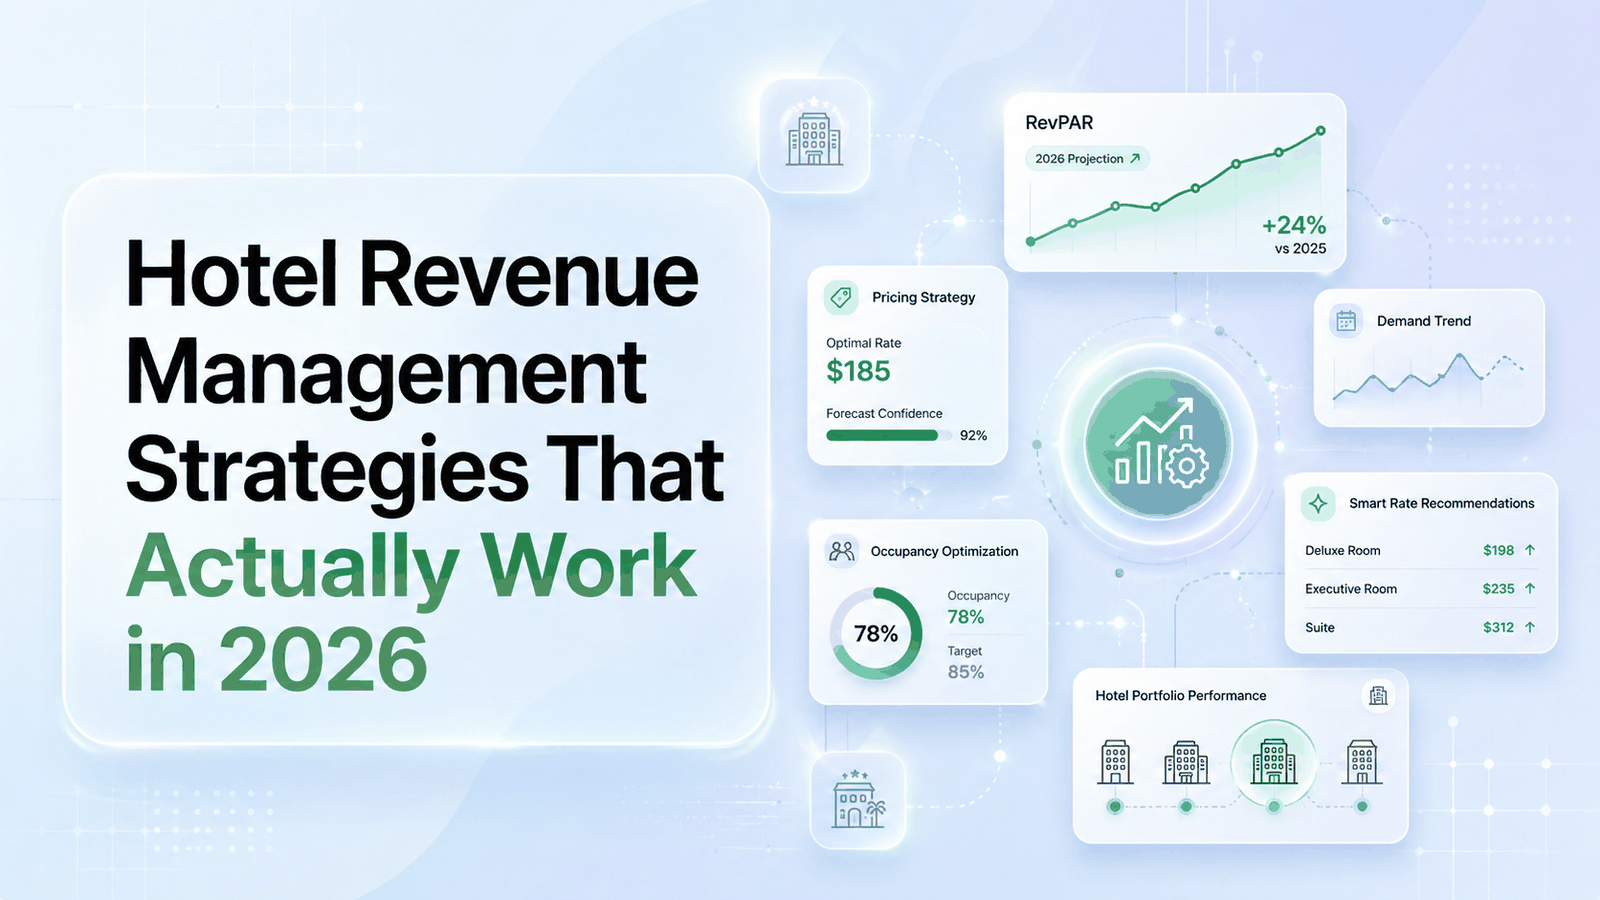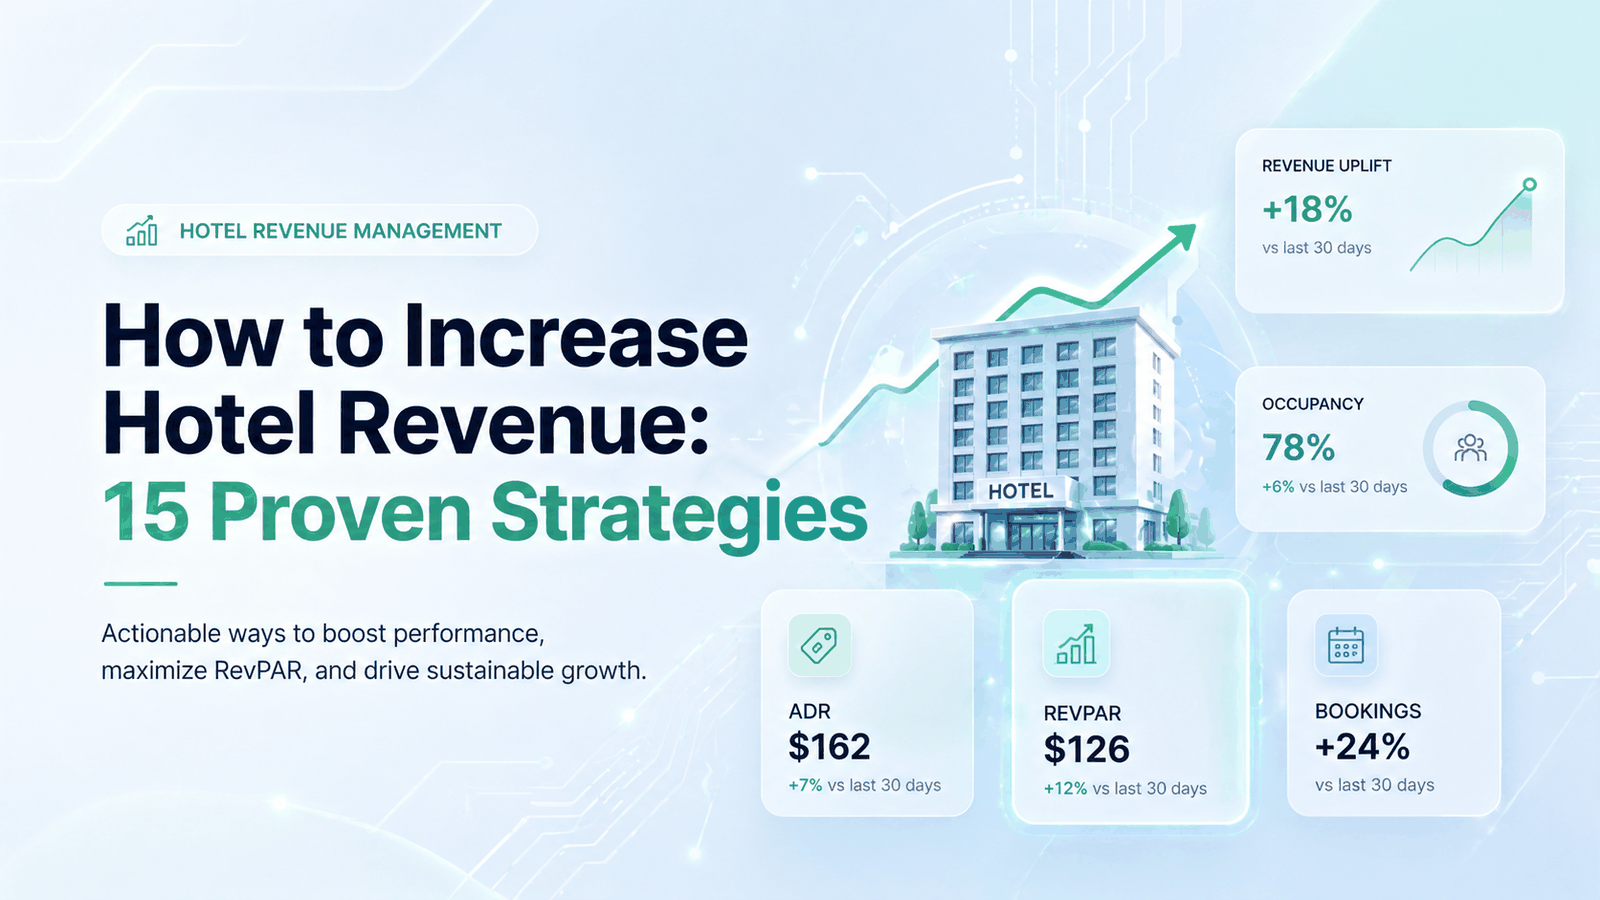
SNIPPET DEFINITION — The 15 most effective ways to increase hotel revenue in 2026 organize into 4 strategic levers: Pricing (dynamic pricing, Open Pricing, comp set calibration, length-of-stay rules, segment forecasting), Distribution (channel manager, OTA rebalancing, GDS optimization, direct booking), Demand Capture (loyalty program, metasearch, content marketing), and Ancillary & Operations (F&B dynamic pricing, packages, automated upsell). Properties implementing all 15 strategies compound a +35–42% RevPAR lift over a no-strategy baseline. Each strategy maps to a specific tactic, a specific tool, and a quantified outcome.
We’re 80 rooms, seasonal resort property with huge demand swings. Summer we’re sold out weeks in advance, winter we’re scraping for occupancy. Feel like I’m leaving money on the table by not having better tools for pricing decisions.
Key takeaways
- The 15 strategies organize into 4 revenue levers: Pricing (5 strategies, 38% of total RevPAR contribution), Distribution (4 strategies, 28%), Demand Capture (3 strategies, 22%), Ancillary & Ops (3 strategies, 12%).
- The single highest-impact strategy is dynamic pricing (S1) at +5.5% RevPAR. The single highest-impact ancillary strategy is dynamic F&B pricing (S13) at +5.2%.
- Cumulative RevPAR lift compounds to +42% when all 4 levers are stacked. The pricing lever delivers ~17% on its own; subsequent levers add diminishing but meaningful incremental lift.
- Channel mix optimization lifts net revenue per booking by 32% — from $128 to $169 — by shifting share from OTA to direct and corporate channels.
- The fastest-payback strategies are S3 (comp set calibration) and S6 (parity correction) — measurable lift in 7–30 days.
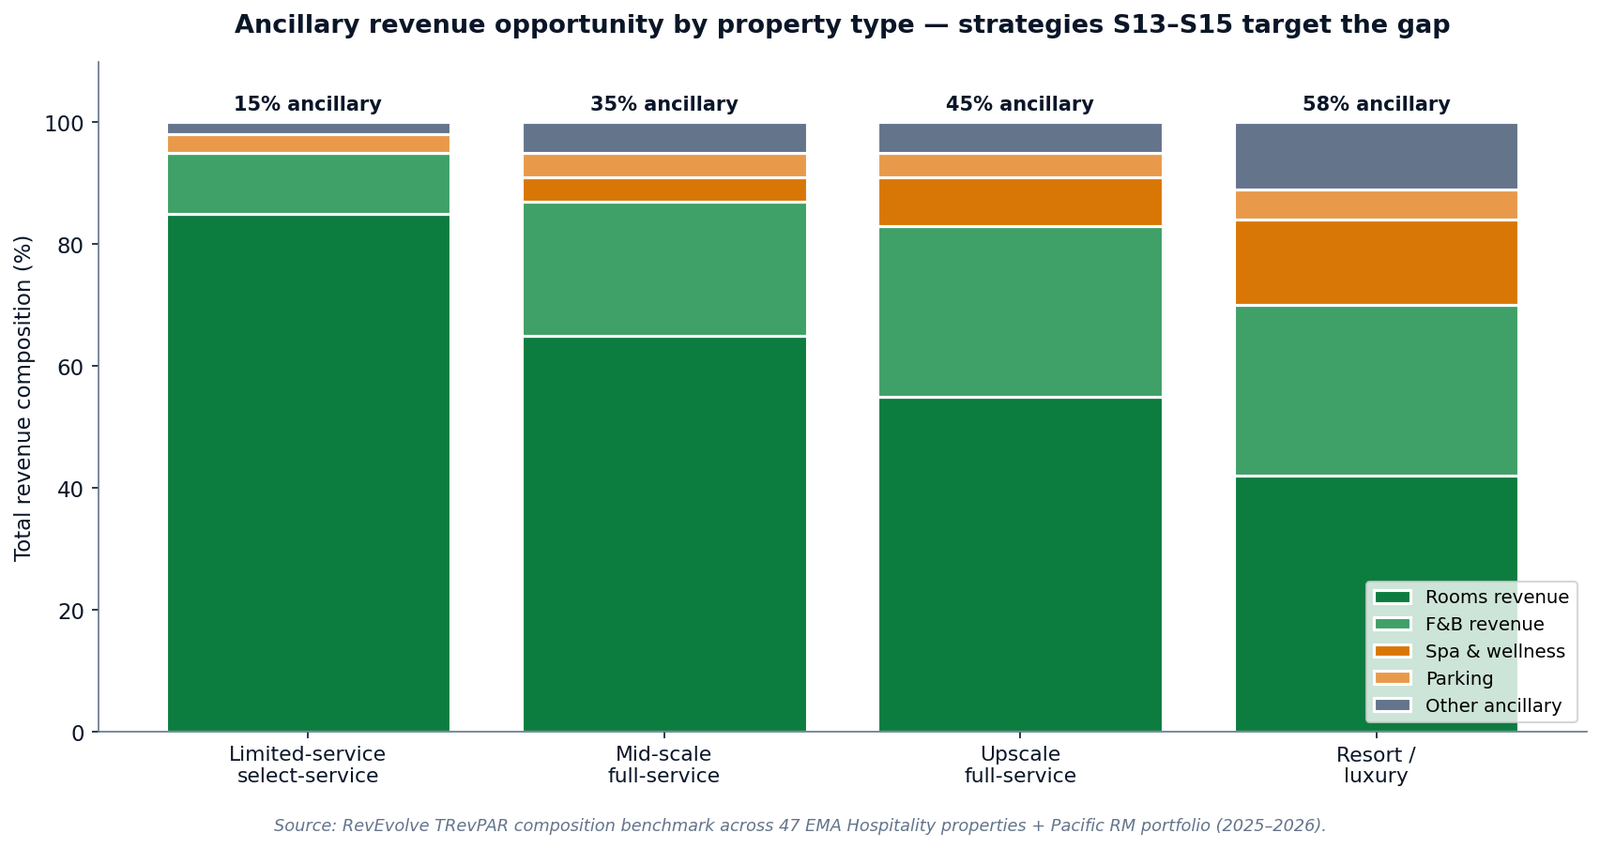
- For resort and luxury properties, ancillary revenue is 58% of total revenue — strategies S13–S15 are not optional, they’re the largest revenue lever.
→ Download the RevEvolve Revenue Growth Checklist — all 15 strategies with implementation steps, RevPAR lift, and tool requirements in a printable 3-page format.
The 4 Revenue Levers — How the 15 Strategies Fit Together
Most "15 ways to increase hotel revenue" articles read like a random list of tactics: try a loyalty program, run a Google Ads campaign, post on Instagram, add a spa package. That’s not a strategy — that’s a to-do list. The framework that actually works groups every revenue strategy into one of 4 levers, each compounding on the previous one.
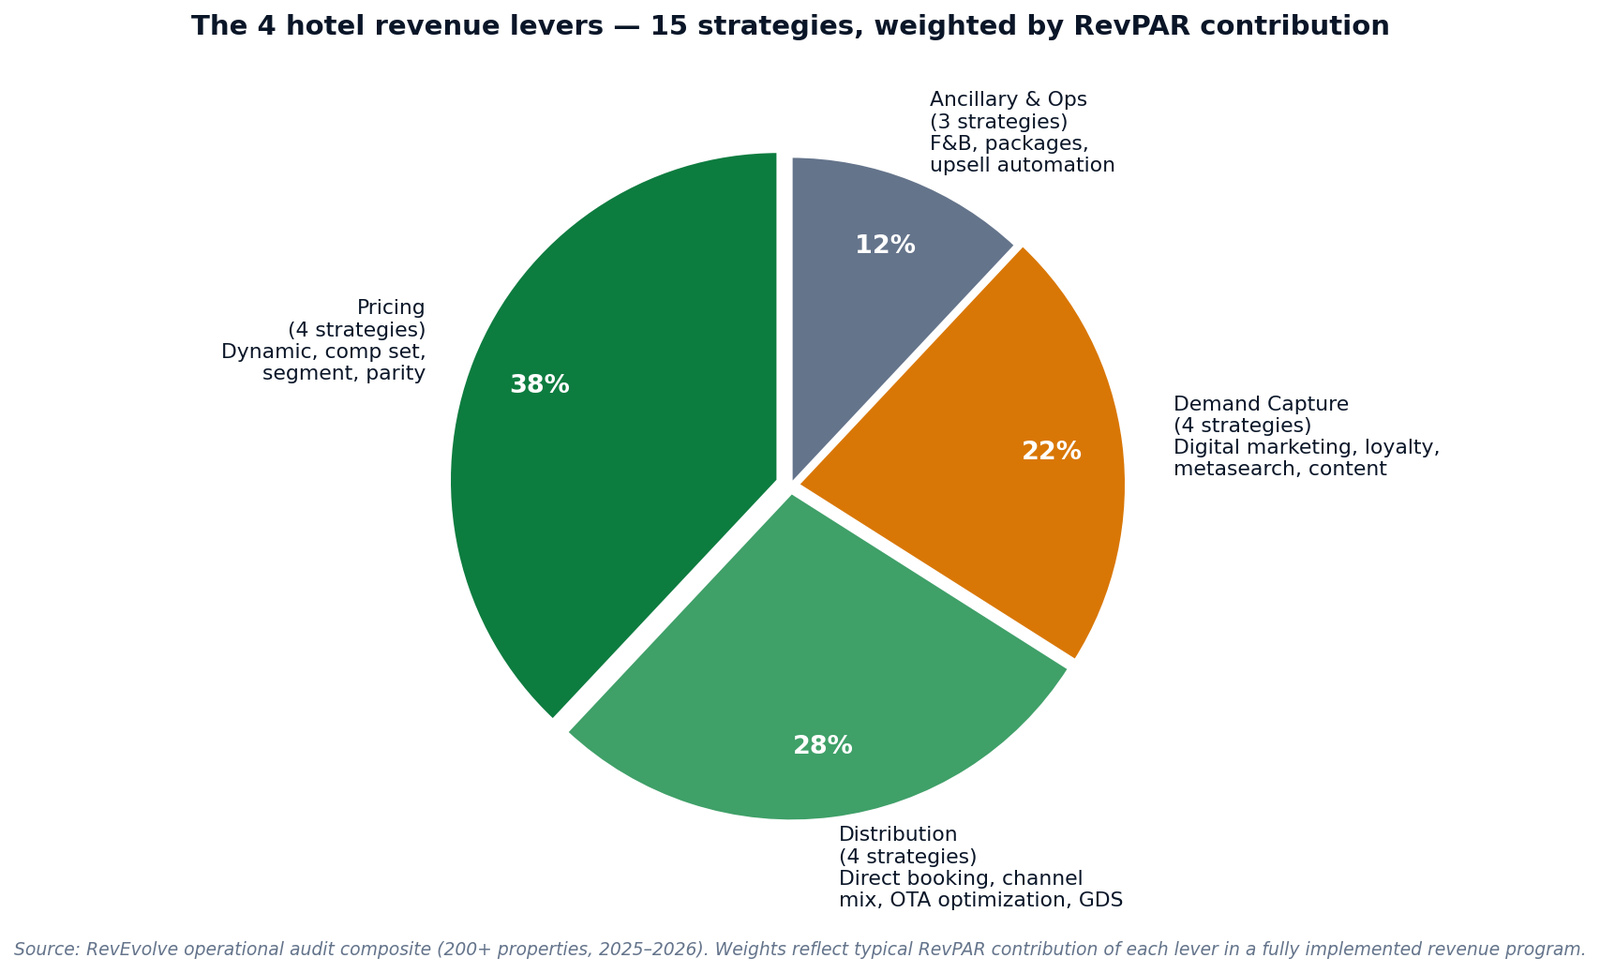
| Lever | # of strategies | RevPAR contribution | Strategies |
|---|---|---|---|
| Pricing | 5 (S1–S5) | 38% | Dynamic pricing, Open Pricing, comp set, LOS rules, segment forecast |
| Distribution | 4 (S6–S9) | 28% | Channel manager, OTA mix, GDS/corporate, direct booking |
| Demand Capture | 3 (S10–S12) | 22% | Loyalty program, metasearch, content marketing |
| Ancillary & Ops | 3 (S13–S15) | 12% | F&B dynamic pricing, packages, automated upsell |
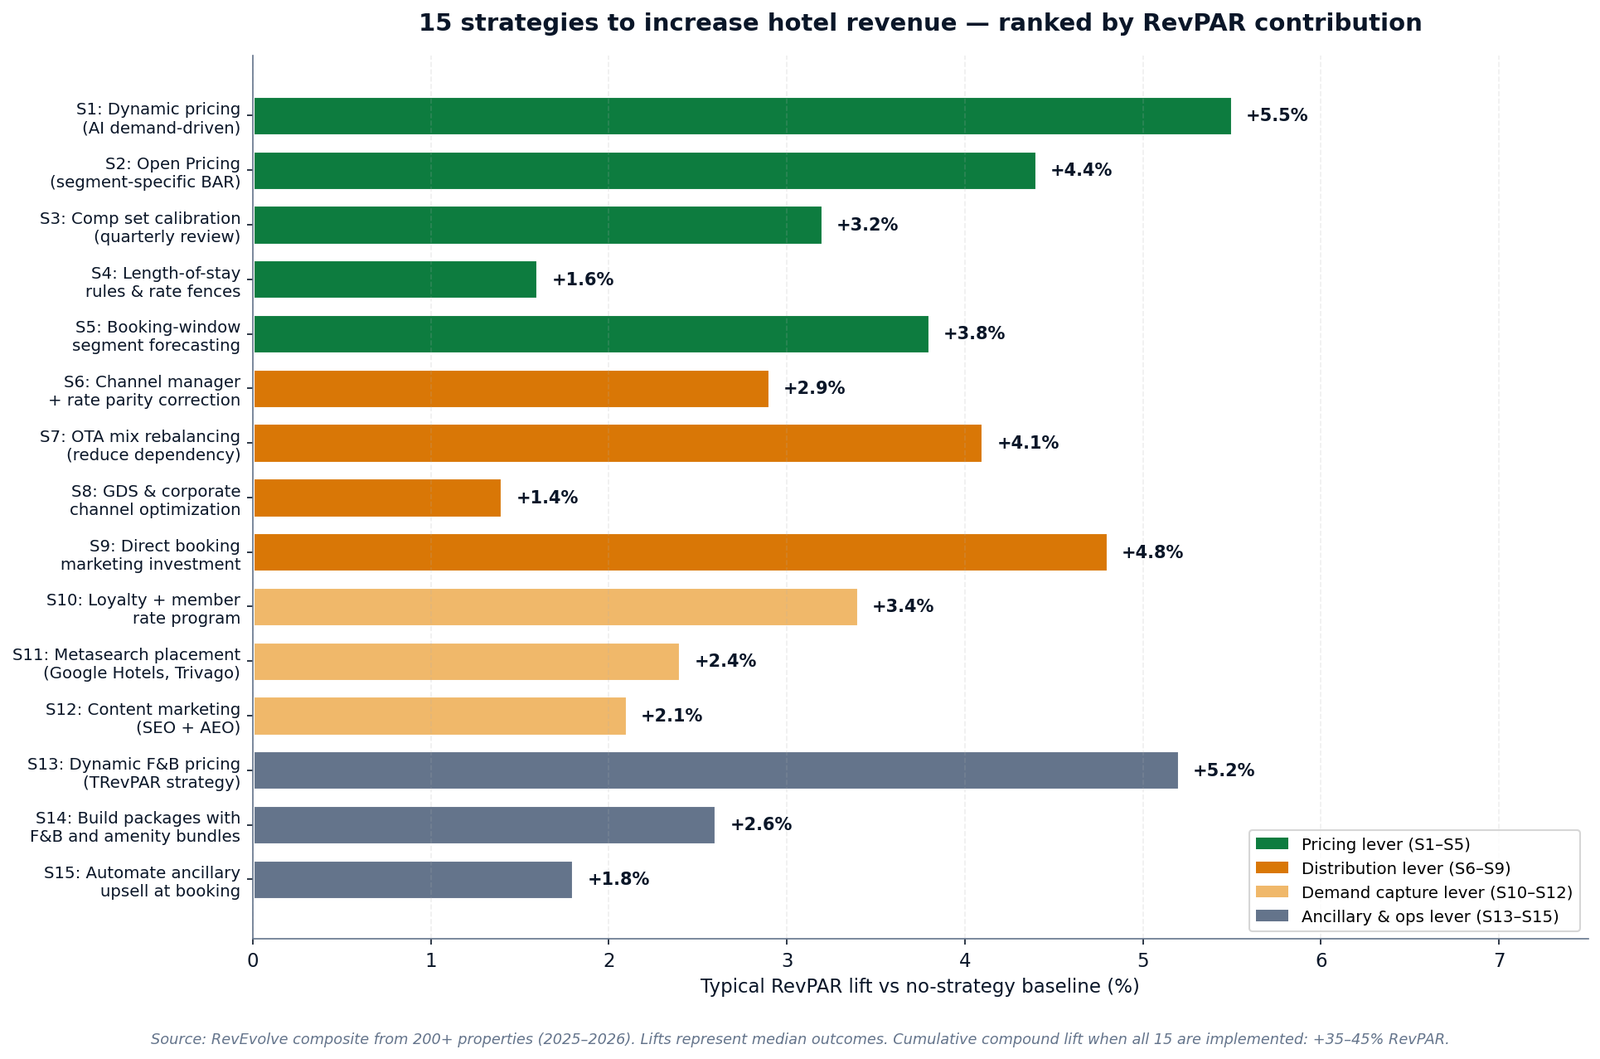
Lever 1 — Pricing (Strategies 1–5)
The pricing lever is the single largest revenue lever — 38% of total RevPAR contribution — because it directly determines the rate every guest pays. Five strategies, ordered by typical impact:
Strategy 1 — Dynamic Pricing (AI demand-driven)
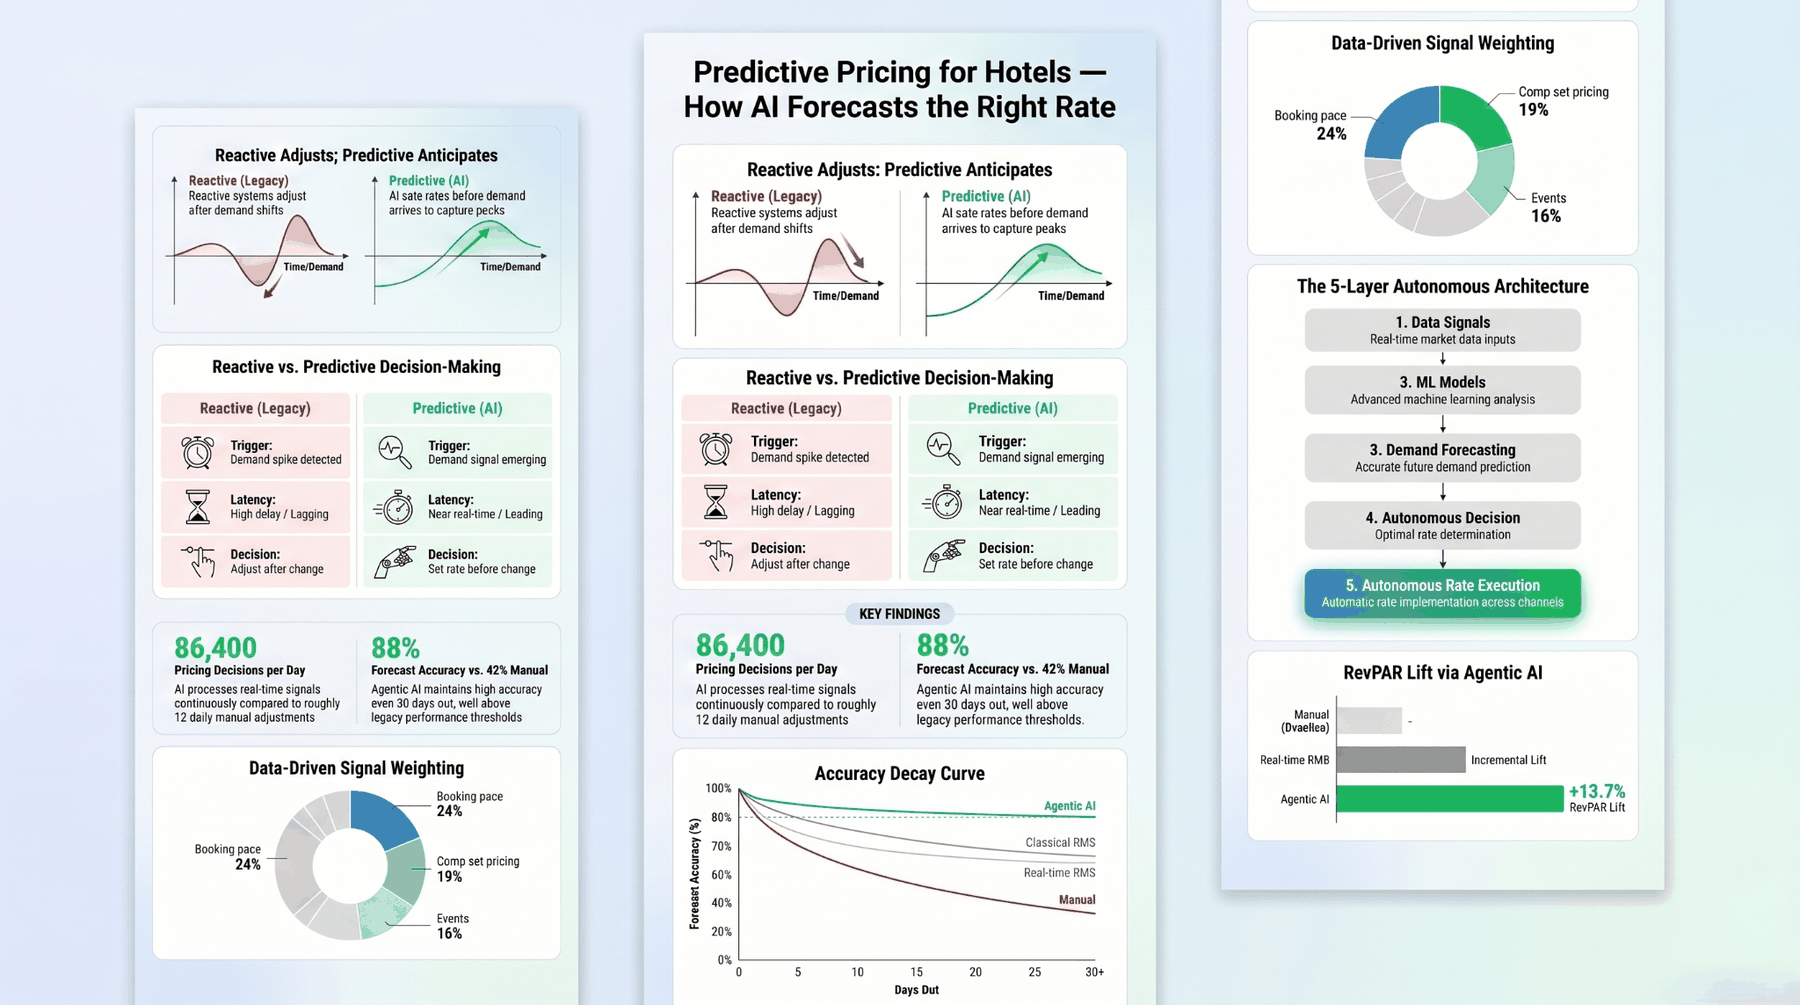
What it is: Replace static seasonal rates with AI-driven dynamic pricing that adjusts BAR continuously based on real-time booking pace, comp set movement, event signals, and demand forecasts. Modern systems make ~86,400 pricing decisions per property per day vs the 12 a manual revenue manager makes.
Why it works: Over-discounting in shoulder season is the #1 source of recoverable RevPAR leakage (32% of total). Dynamic pricing replaces the human instinct to "fill rooms" at suboptimal rates with an algorithm calibrated on actual demand signals.
Strategy 2 — Open Pricing (segment-specific BAR)
What it is: Move from a single BAR ladder (where all rate types move together) to Open Pricing — each rate type (BAR, member, corporate, package, group) floats independently based on segment-specific demand. A corporate rate doesn’t need to drop just because leisure demand is soft; a member rate doesn’t need to rise when corporate is sold out.
Why it works: Different segments have different price elasticity. Locked rate ladders force you to over-price segments with strong demand or under-price segments with weak demand. Open Pricing lets you optimize each segment independently.
Strategy 3 — Comp Set Calibration (quarterly review)
What it is: Verify quarterly that the 5–7 hotels your RMS compares you against are the hotels guests actually substitute with — not aspirational properties or stale picks from 18 months ago. Comp set drift is the silent killer of pricing accuracy.
Why it works: A wrong comp set produces a wrong competitive signal, which produces a mispriced BAR — typically 5–9% below what the market actually supports. Hotels with ego-picked comp sets systematically over-price and lose occupancy.
Strategy 4 — Length-of-Stay Rules and Rate Fences
What it is: Apply minimum-stay restrictions on peak nights to capture multi-night bookings instead of single-night turnover; apply rate fences (advance-purchase, non-refundable, member-only) to segment price-sensitive demand from price-insensitive demand.
Why it works: A peak Saturday sold for $300 to a single-night guest leaves the surrounding Friday and Sunday at sub-optimal rates because demand for those nights is diluted. A 2-night minimum on peak Saturday forces multi-night bookings that fill all three nights at higher cumulative ADR.
Strategy 5 — Booking-Window Segment Forecasting
What it is: Segment your demand forecast by booking window (0–7, 8–30, 31–60, 61–180 days) AND by segment (corporate, leisure, group, government). A "60% occupancy on pace" number doesn’t tell you whether to discount or hold; the segment-window breakdown does.
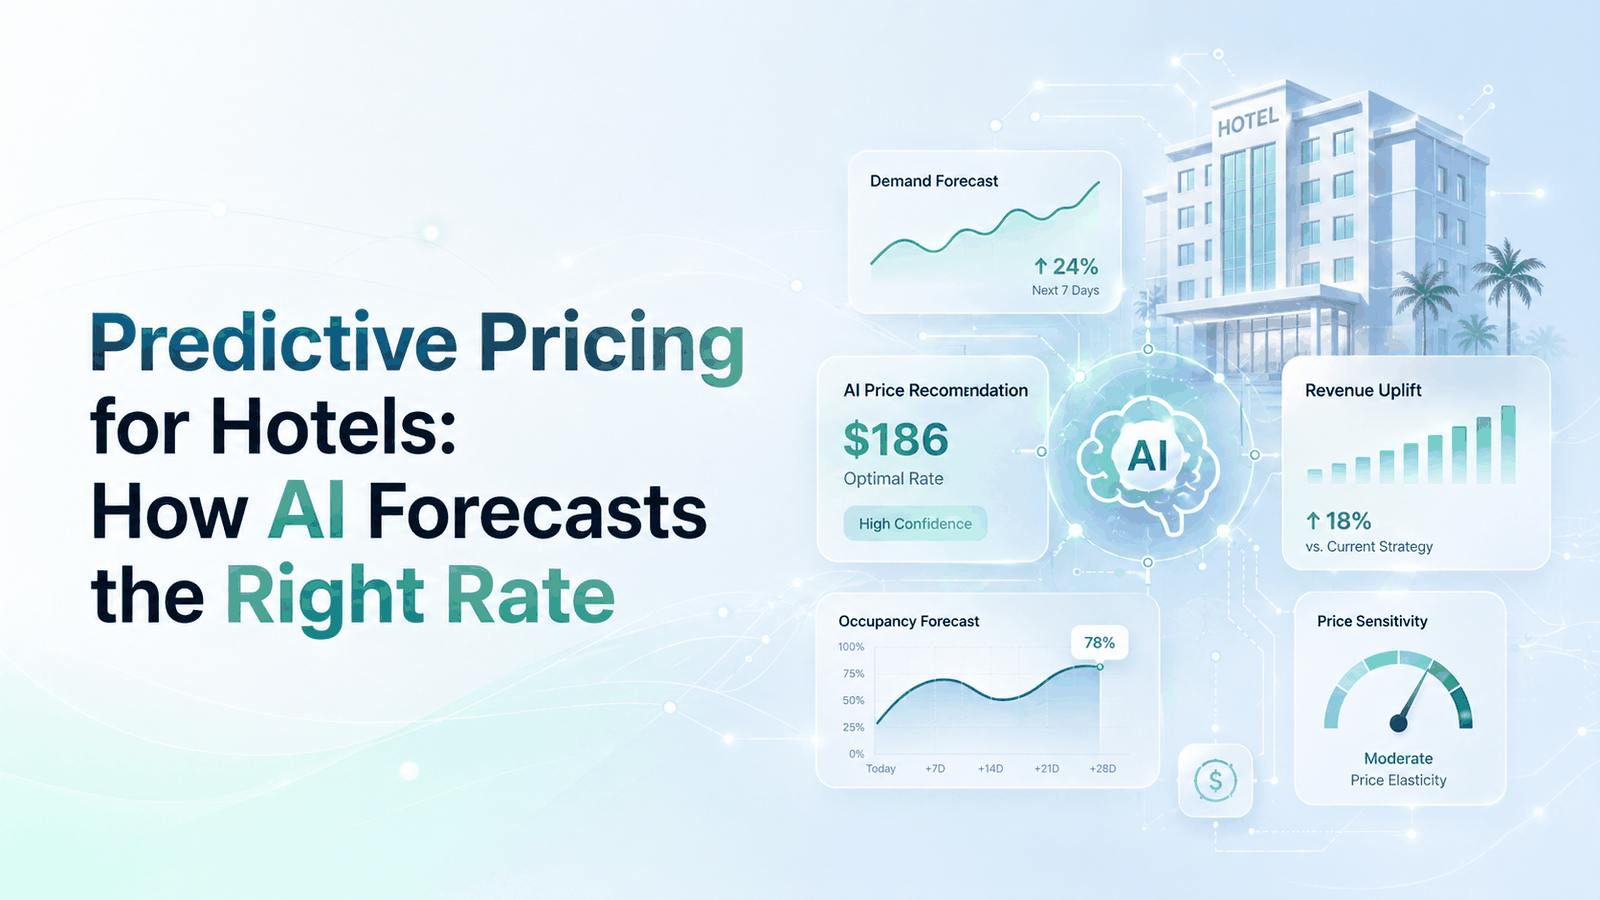
Why it works: Corporate books 7–14 days out (price-insensitive); leisure books 30–60 days out (price-sensitive); group blocks 90–180 days out. The right pricing decision is opposite for each segment. Forecasting only total occupancy means averaging signals that should be opposite. See the full predictive pricing guide.
The pricing lever delivers ~17% RevPAR lift on its own when all 5 strategies are implemented. That’s before any distribution or demand-capture work. Properties skipping the pricing lever and jumping to marketing are pouring water into a leaking bucket — they capture more demand at suboptimal rates and never see the lift.
Lever 2 — Distribution (Strategies 6–9)
The distribution lever determines where and how each booking arrives — and therefore how much commission you pay to acquire it. Four strategies that compound to lift net revenue per booking by 32%.
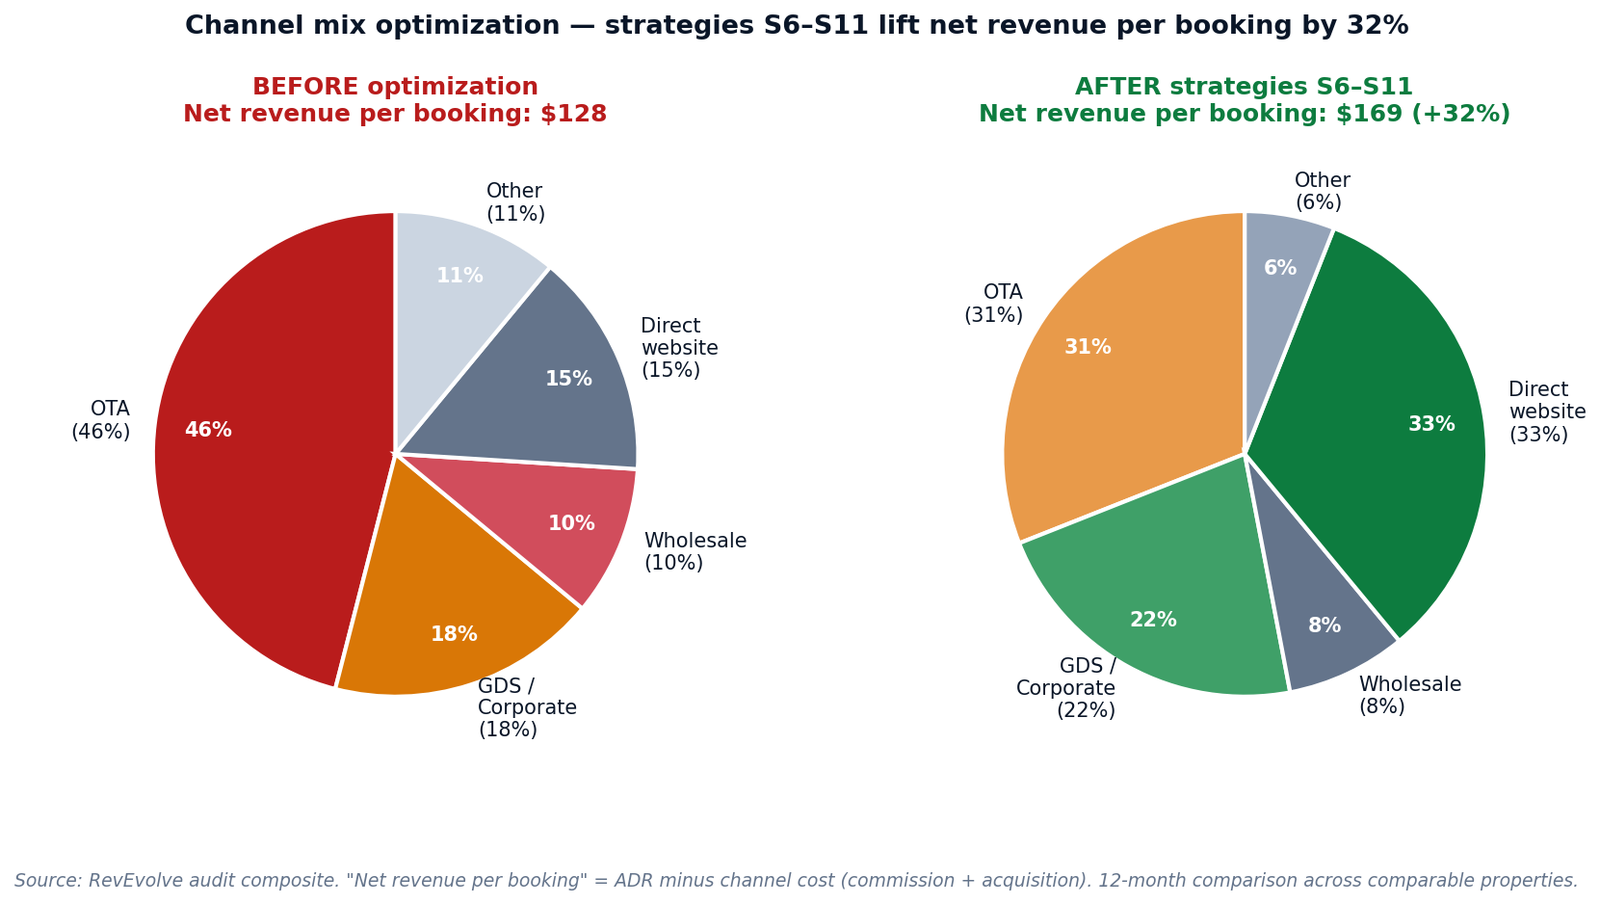
Strategy 6 — Channel Manager + Rate Parity Correction
What it is: Deploy a channel manager that pushes rates and inventory to all OTAs, GDS, and meta channels in real time — paired with autonomous rate parity correction that catches and fixes violations within minutes, not days.
Why it works: Parity violations reduce direct booking conversion by ~38% and trigger OTA ranking penalties. 78% of violations come from sources outside your direct control (wholesaler leakage, OTA-funded discounting). Detection is necessary; autonomous correction is what closes the leak.
Strategy 7 — OTA Mix Rebalancing (reduce dependency)
What it is: Audit your OTA dependency. If OTA share exceeds 35–40% of total bookings, you’re paying more in commission than necessary. The fix is structured: shift incremental new demand toward direct, GDS, and corporate channels via member rates, GDS contracts, and corporate negotiated rates.
If you book on Expedia, I have to pay them a percentage. This eats into my profits. If the guest calls Expedia or Booking.com and complains, they call us and say ‘can you do anything to make the guest happy?’ and we have to move them or give them a credit — because if we don’t they will deprioritize us in search results.
Why it works: Every percentage point of OTA mix shifted to direct saves ~17 commission cents on the dollar. On a $200 booking, that’s $34 incremental net revenue — a 17% margin uplift on that booking with no rate change.
Strategy 8 — GDS and Corporate Channel Optimization
What it is: Activate or expand presence on GDS (Sabre, Amadeus, Travelport) and negotiated corporate rates with local employers, government entities, and consortia. These are typically the highest-ADR, lowest-acquisition-cost channels available to a property.
Why it works: GDS bookings come from corporate travel managers and travel agents — audiences that book at higher ADR (~12–18% above OTA average) with lower commission (typically 8–10% vs 15–18% for OTAs). For properties with corporate demand in the market, under-utilized GDS is leaving high-margin revenue on the table.
Strategy 9 — Direct Booking Marketing Investment
What it is: Build a structured direct-booking marketing program: paid search on branded terms, retargeting OTA visitors who didn’t convert, on-site rate-comparison widgets, and conversion-rate optimization on your booking engine. This is the demand-side investment that complements the supply-side member rate structure.
Why it works: Most independent properties spend nothing on direct booking marketing and wonder why their direct share is below 20%. The OTAs are spending billions to acquire your guests on branded search; reclaiming even 30% of that traffic at $3–6 CPC pays back 4–8× in commission savings.
Lever 3 — Demand Capture (Strategies 10–12)
The demand capture lever generates incremental demand that wouldn’t exist otherwise — from loyalty repeat business, metasearch visibility, and content-driven discovery. Three strategies focused on bringing new bookings to the property.
Strategy 10 — Loyalty Program + Member Rate Structure
What it is: A real loyalty program with member rates (BAR −5–10%), points-based redemption, and tiered benefits (room upgrades, late checkout, F&B credits). Independent properties can build this in-house; brands have it built in. The member rate structure is the legal mechanism for rates outside OTA parity contracts.
Why it works: Loyalty members book 32% more frequently than non-members, stay 18% longer per booking, and book direct 73% of the time — vs 22% for non-members. The member rate isn’t a discount; it’s an acquisition lever.
Strategy 11 — Metasearch Placement (Google Hotels, Trivago, KAYAK)
What it is: Bid on Google Hotel Ads, Trivago, and KAYAK to surface your direct rate alongside OTAs in metasearch results. When a guest searches for your property on Google, your direct rate appears next to Booking.com’s rate.
Why it works: Metasearch is where guests comparison-shop. If you’re not bidding, the OTAs win the click by default. Modern metasearch with cost-per-acquisition (CPA) bidding lets you set a maximum acquisition cost and only pay when bookings convert — a fraction of OTA commission.
Strategy 12 — Content Marketing (SEO + AEO)
What it is: Build a content engine on your property website that ranks for destination, neighbourhood, and intent queries. In 2026, this means optimizing for both Google (SEO) and AI engines like ChatGPT, Perplexity and Gemini (AEO — Answer Engine Optimization).
Why it works: Top-of-funnel destination content drives discovery; mid-funnel comparison content drives consideration; bottom-funnel direct-booking content drives conversion. AI engines now answer 30%+ of travel research queries, and they cite specific properties when content is well-structured for citation.
Lever 4 — Ancillary & Operations (Strategies 13–15)
The ancillary lever is the one most operators leave on the table. For full-service and resort properties, ancillary revenue (F&B, spa, parking, packages) is 35–58% of total revenue — yet most properties price these streams once a year and never adjust.
Our property has more complex reservations than a standard hotel. Different room categories, packages that include spa treatments or dining credits, seasonal pricing, group blocks, contracted corporate rates. Current system handles basic bookings fine but anything complex requires workarounds. Packages are manual, inventory restrictions aren’t enforced automatically, group bookings are basically spreadsheets outside the system.
Strategy 13 — Dynamic F&B Pricing (the TRevPAR strategy)
What it is: Apply revenue management discipline to F&B pricing the same way you do to rooms: peak vs off-peak menu pricing, dynamic banquet pricing, daily-changing prix-fixe options that respond to occupancy and event demand, automated pricing for in-room dining and minibar.
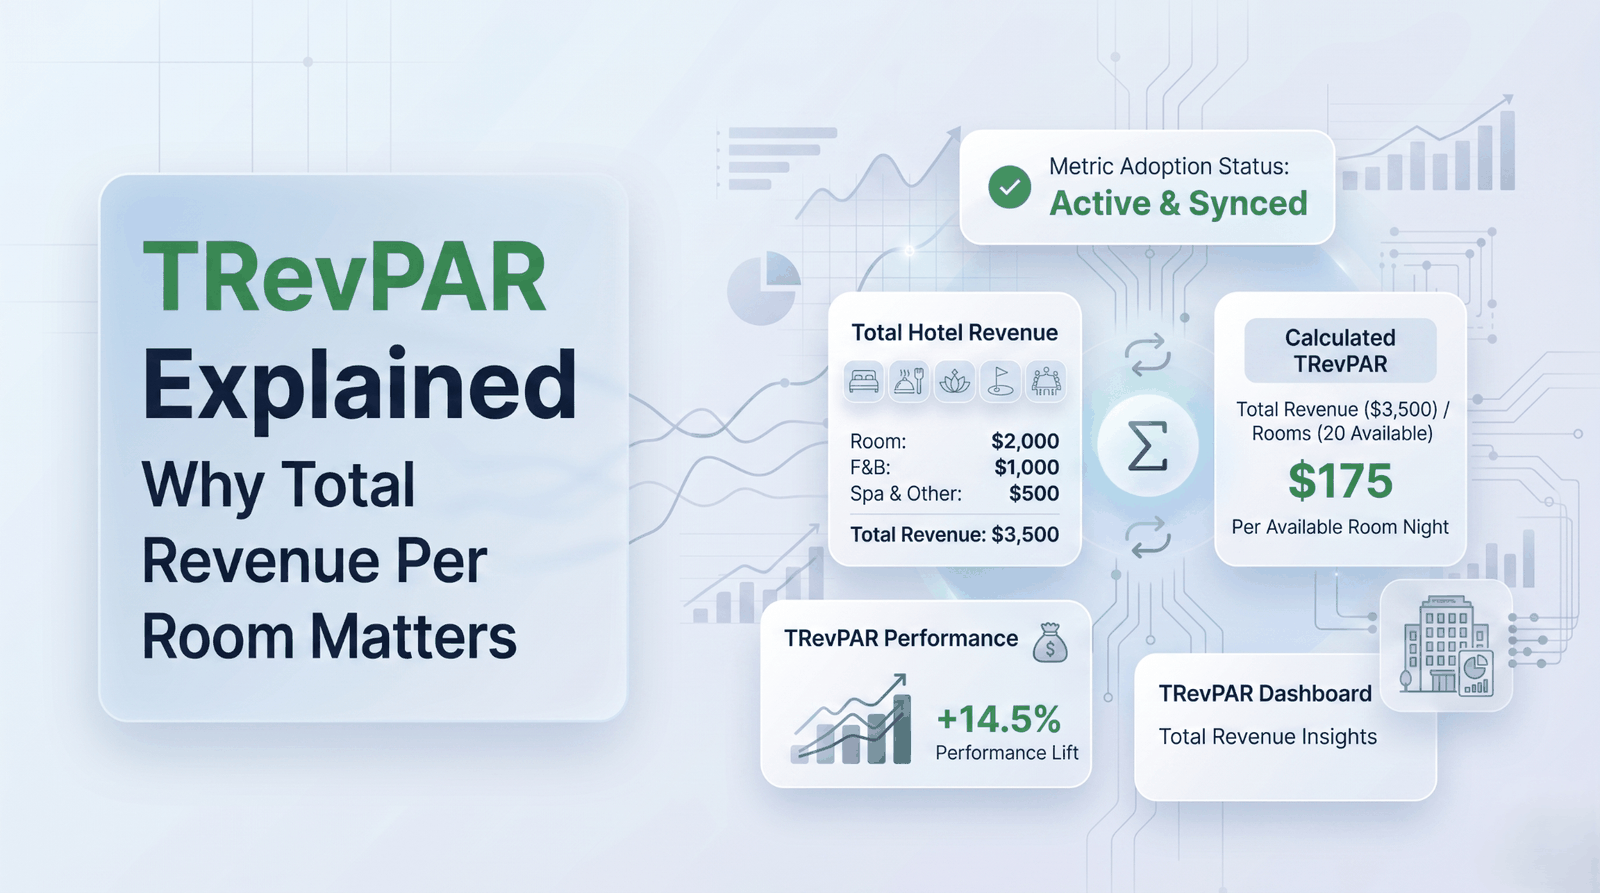
Why it works: F&B contribution margins are 60–75% — higher than rooms. Every dollar shifted from rooms revenue to ancillary F&B revenue typically improves GOPPAR more than the same dollar of room revenue growth. See the TRevPAR guide for the full framework.
Strategy 14 — Build Packages with F&B and Amenity Bundles
What it is: Create rate packages that bundle rooms with F&B credits, spa treatments, parking, and other amenities into a single price. Packages serve two purposes: they sit legally outside OTA parity contracts (so you can offer them direct-only), and they increase total spend per booking by 22–40%.
Why it works: A guest comparing your $250 BAR vs Booking.com’s $250 has no reason to book direct. The same guest comparing your $310 package (room + dinner + breakfast + late checkout) vs Booking.com’s $250 has a clear value proposition — and you’re capturing F&B revenue at higher margin than the rooms portion.
Strategy 15 — Automate Ancillary Upsell at Booking and Pre-Arrival
What it is: Deploy automated upsell prompts at three points: at the booking engine ("Add airport transfer for $35"), in the pre-arrival email ("Reserve a spa treatment — limited availability"), and at check-in ("Upgrade to suite for $40"). Modern upsell systems use AI to personalize offers based on booking type, segment, and historical conversion data.
Why it works: Upsell conversion rates run ~3–5% at the booking engine, ~12–18% at pre-arrival email, and ~22–28% at check-in. Pre-arrival is the highest-conversion touchpoint because the guest is already committed and excited.
Costs are rising faster than revenue. 2026 is shaping up as a margin-preservation year, with hotel rates only up modestly and RevPAR basically flat.
The Compound Effect — How the 4 Levers Stack
The 15 strategies are not independent. Each lever amplifies the next: better pricing makes distribution work harder; better distribution captures the demand from your demand-capture lever; better demand capture justifies the ancillary investment.
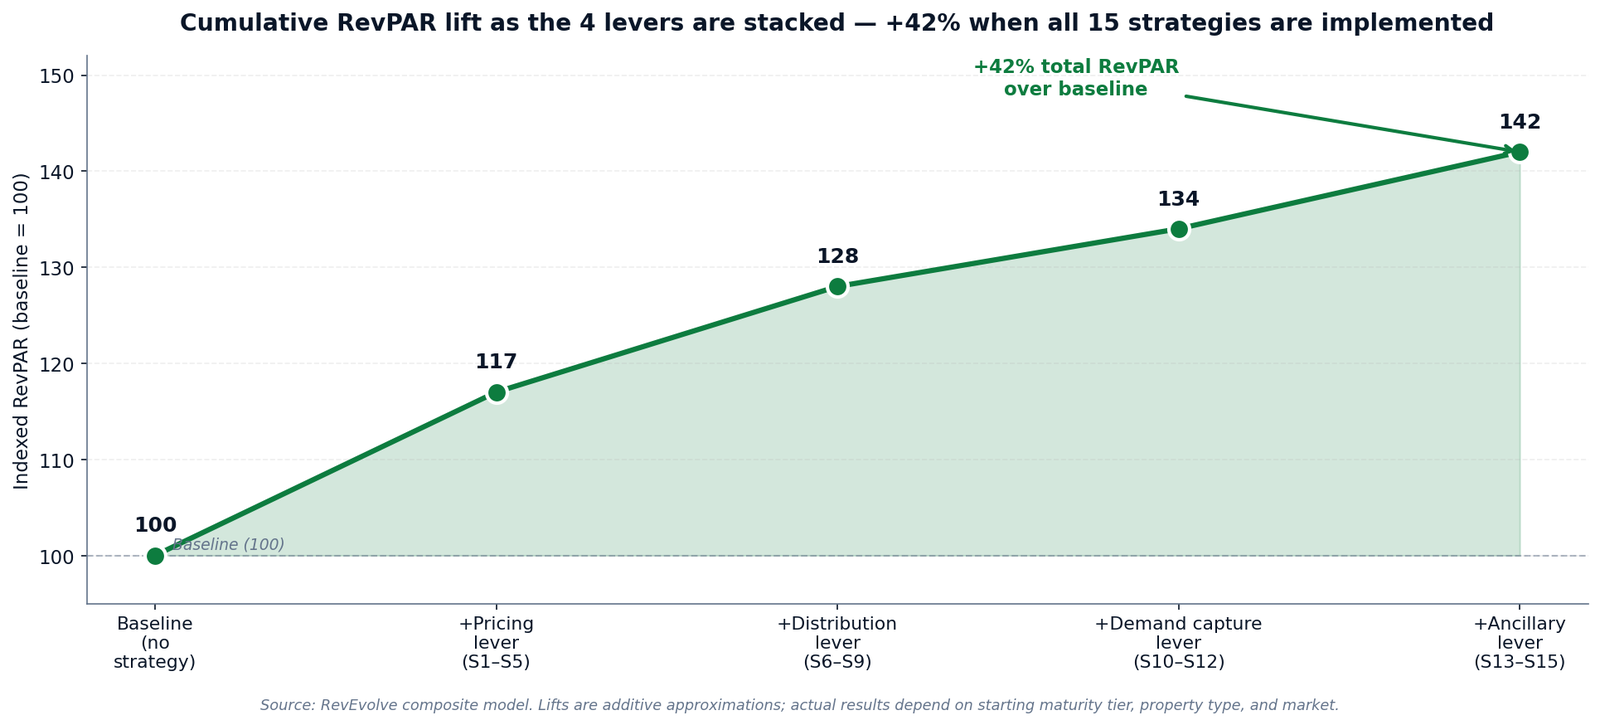
| Lever | Strategies | Indexed RevPAR | Incremental lift |
|---|---|---|---|
| Baseline (no strategy) | — | 100 | — |
| Add Pricing lever | S1–S5 | 117 | +17% |
| Add Distribution lever | S6–S9 | 128 | +11% |
| Add Demand Capture lever | S10–S12 | 134 | +6% |
| Add Ancillary & Ops lever | S13–S15 | 142 | +8% |
The right sequence — don’t skip levers
Implementation order matters. Properties that start with the marketing-heavy levers without fixing pricing first end up driving expensive demand to mispriced inventory. Properties that start with ancillary without fixing the rooms business first don’t have enough booked guests to upsell to. The order:
- Pricing lever first (Months 1–3) — dynamic pricing, comp set, segment forecasting. The foundation everything else depends on.
- Distribution lever second (Months 3–6) — channel mix, parity correction, OTA rebalancing. Captures more value per booking before scaling demand.
- Demand capture third (Months 4–9) — loyalty, metasearch, content marketing. Now you have the right rates and the right channels; scale demand into them.
- Ancillary lever fourth (Months 6–12) — F&B pricing, packages, upsell. Most operationally complex but highest GOPPAR contribution per dollar invested.
The 5 Most Expensive Mistakes Hotels Make Trying to Increase Revenue
Mistake 1 — Treating "increase revenue" as a marketing problem
Most independent operators default to "we need more bookings" when revenue is soft. The actual answer is usually "we need better-priced bookings" or "we need higher-margin bookings." Marketing is the demand-capture lever — it’s lever 3 of 4. Skipping levers 1 and 2 means scaling demand into a pricing system that captures less of it than it should.
Mistake 2 — Implementing strategies as one-time fixes instead of continuous loops
Comp set calibration is not a one-time selection — it’s a quarterly review. Dynamic pricing is not a tool you turn on — it’s a daily decision loop. Loyalty programs are not a launch — they’re a continuous engagement engine. Most strategies that "fail" actually launched correctly and then weren’t maintained.
Mistake 3 — Scaling marketing spend without measuring incremental cost of acquisition
Many properties report "direct bookings up 18%" without acknowledging that direct booking marketing spend was up 30%. The metric that matters is incremental cost of acquisition: how much did we spend to get this incremental booking. If CPA exceeds OTA commission, you’re losing money on the shift.
Mistake 4 — Ignoring ancillary because "we’re not a resort"
Even limited-service properties have parking revenue, in-room dining revenue, late checkout fees, and pet fees. The strategies (dynamic pricing, packages, upsell automation) apply at any property with any non-rooms revenue stream. The mistake is treating ancillary as fixed-price cost recovery instead of a dynamic revenue stream.
Mistake 5 — Trying to implement all 15 strategies simultaneously
A property with no revenue management discipline cannot implement 15 strategies in a single quarter — the operational complexity overwhelms the team and most strategies launch poorly. The 4-lever sequence exists for a reason: each lever takes 60–90 days to embed and prove out before adding the next.
Conclusion — 15 Strategies, 4 Levers, 1 Compounding Stack
The hotels that compound RevPAR over the next 36 months are not the ones with the most expensive RMS or the largest marketing budget. They’re the ones who:
- Recognize that the 15 strategies are 4 levers, not 15 unrelated tactics
- Implement in lever order — pricing first, distribution second, demand capture third, ancillary fourth
- Run each strategy as a continuous loop, not a one-time implementation
- Measure compound RevPAR lift quarterly against the +42% theoretical ceiling
- Treat ancillary revenue as the 2026 margin-preservation lever, not an afterthought
Over a 6-month period, this led to a 12% increase in RevPAR. The key levers were: correcting over-discounting in shoulder seasons, adjusting rates around local events, giving revenue managers control via a pricing dashboard.
That +12% data point is real, achievable, and only requires the pricing lever (S1–S5). The +42% compound lift requires all 4 levers — but every property can start with whichever lever fits their current operational maturity.
Stop looking for one trick to increase hotel revenue. Build the stack.
- → Download the RevEvolve Revenue Growth Checklist — all 15 strategies with implementation steps, RevPAR lift, and tool requirements in a printable 3-page format.
- → Request a demo of RevEvolve — see strategies S1–S6 running as one autonomous system across a real portfolio. 15-min walkthrough.