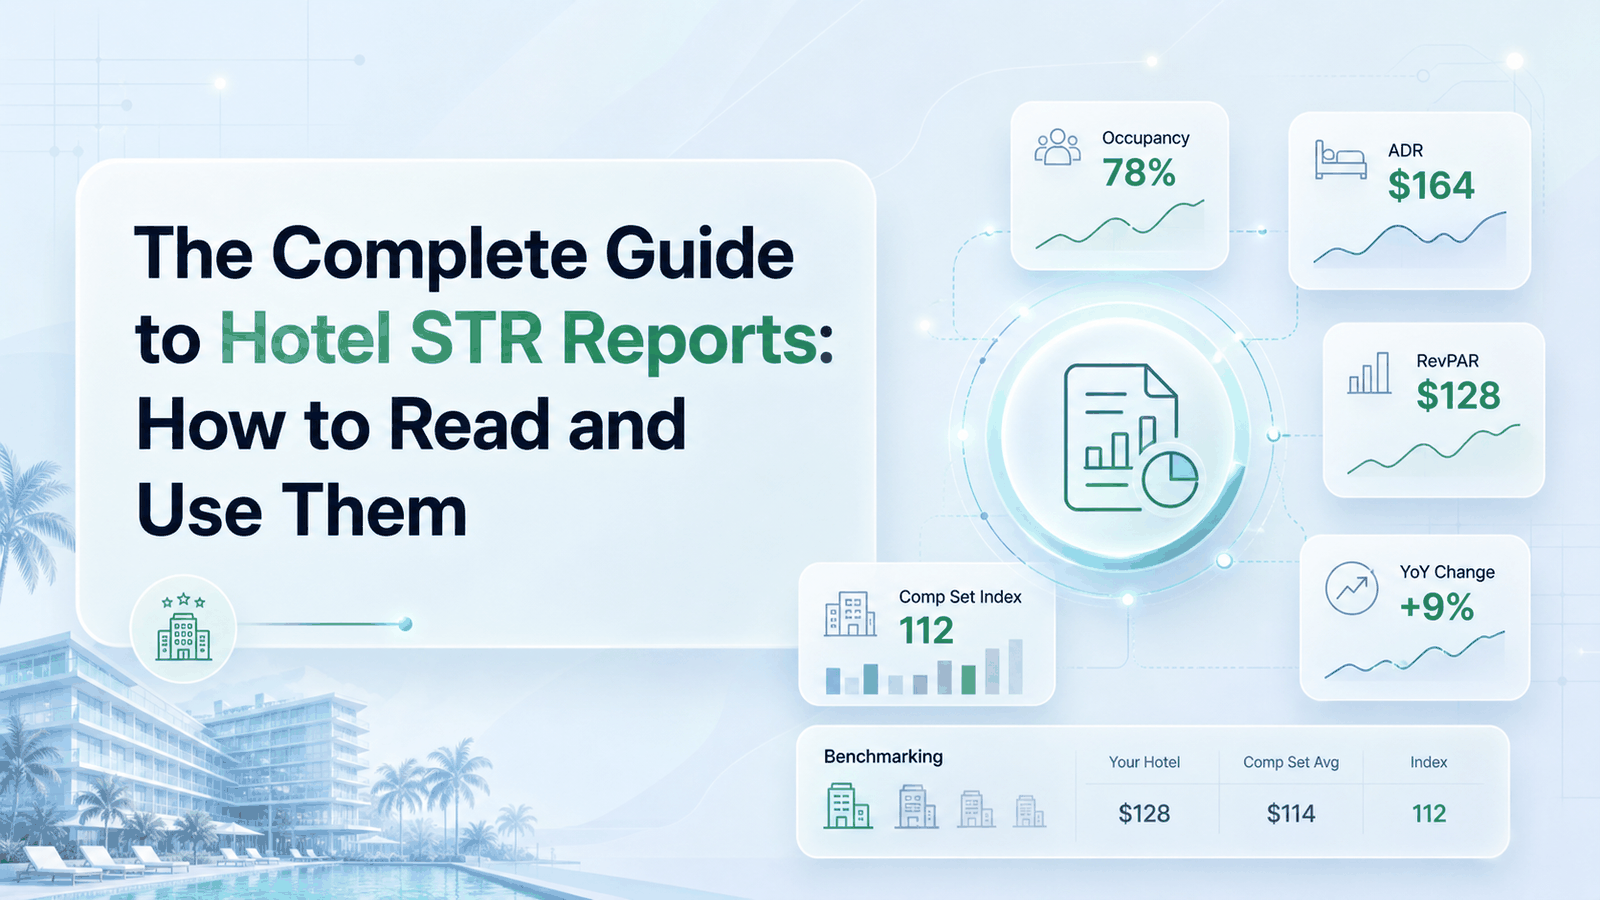
SNIPPET DEFINITION — A hotel STR report (Smith Travel Research, now part of CoStar) is a weekly competitive benchmark report that compares your hotel’s performance to a self-selected comp set across three indices: RGI (Revenue Generating Index — RevPAR vs comp set), MPI (Market Penetration Index — occupancy vs comp set), and ARI (Average Rate Index — ADR vs comp set). An index of 100 = fair share. Below 100 = under-indexing; above 100 = over-indexing. Most operators read STR reports without acting on them. The 5-zone RGI framework + MPI/ARI diagnostic matrix turn the report into actual decisions.
Key takeaways
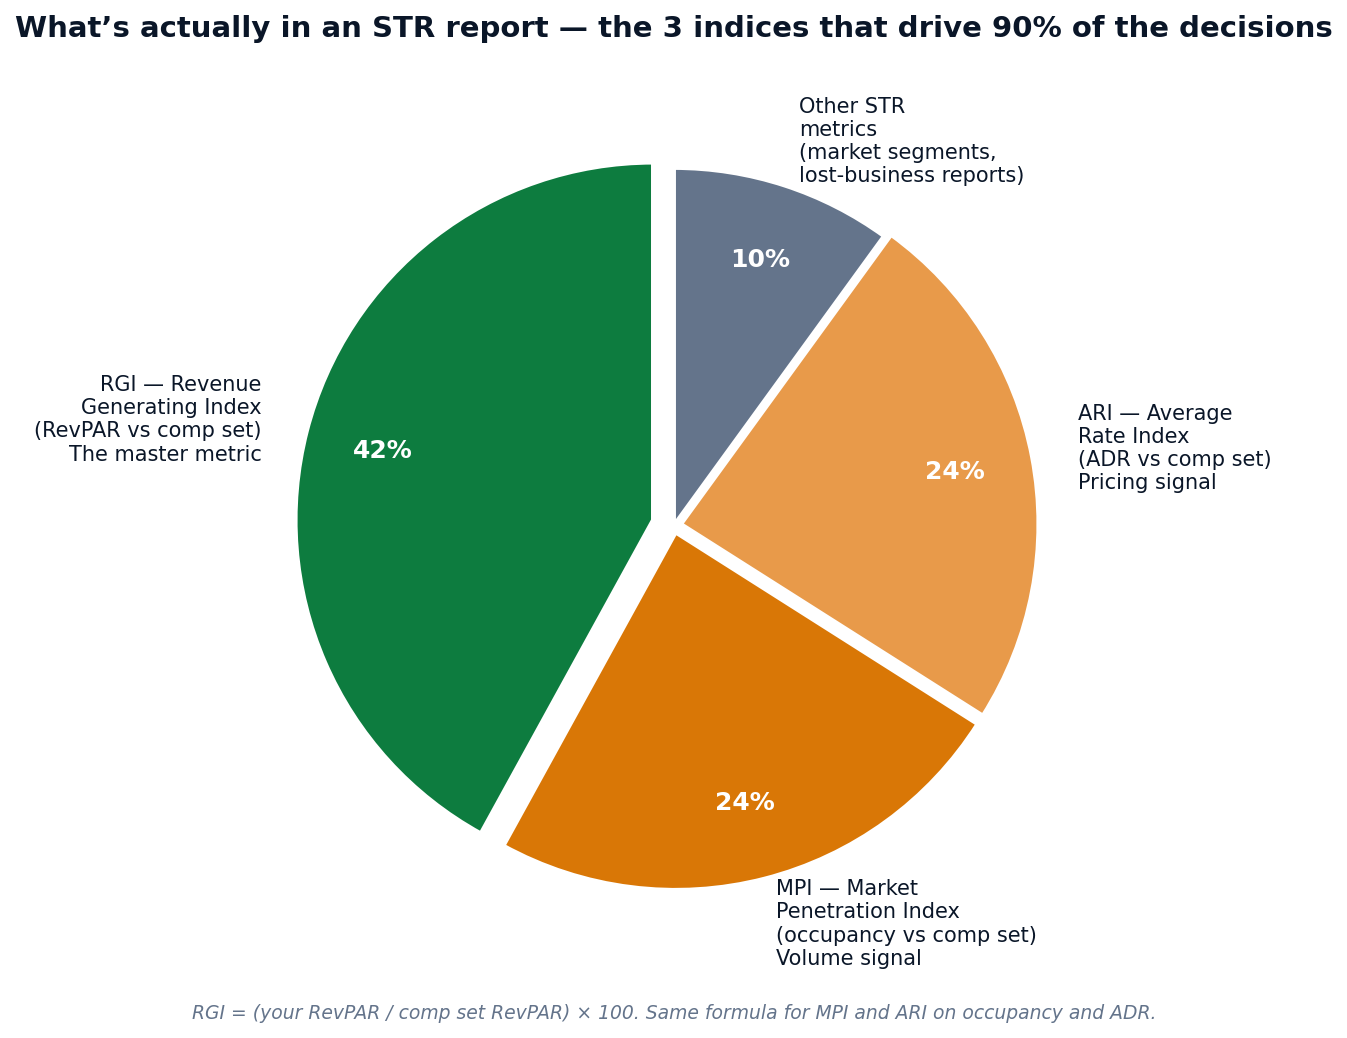
- STR reports compare your property to a comp set across 3 indices that drive 90% of decisions: RGI (master metric), MPI (volume signal), ARI (pricing signal).
- RGI = (your RevPAR ÷ comp set RevPAR) × 100. Index 100 = fair market share. The 5 decision zones: below 90 investigate, 90–95 adjust, 95–105 hold, 105–115 outperforming, above 115 investigate (over-priced, or stale comp set?).
- The MPI × ARI quadrant matrix diagnoses why your RGI is what it is: high ARI / low MPI = over-priced; low ARI / high MPI = leaving rate on the table; high both = market leader; low both = compounding underperformance.
- Comp set drift is the #1 STR report failure mode. An un-calibrated comp set produces false signals: a property that has held +3% true RGI for 12 months can show −15% drifted RGI — leading to defensive discounting that destroys real RevPAR.
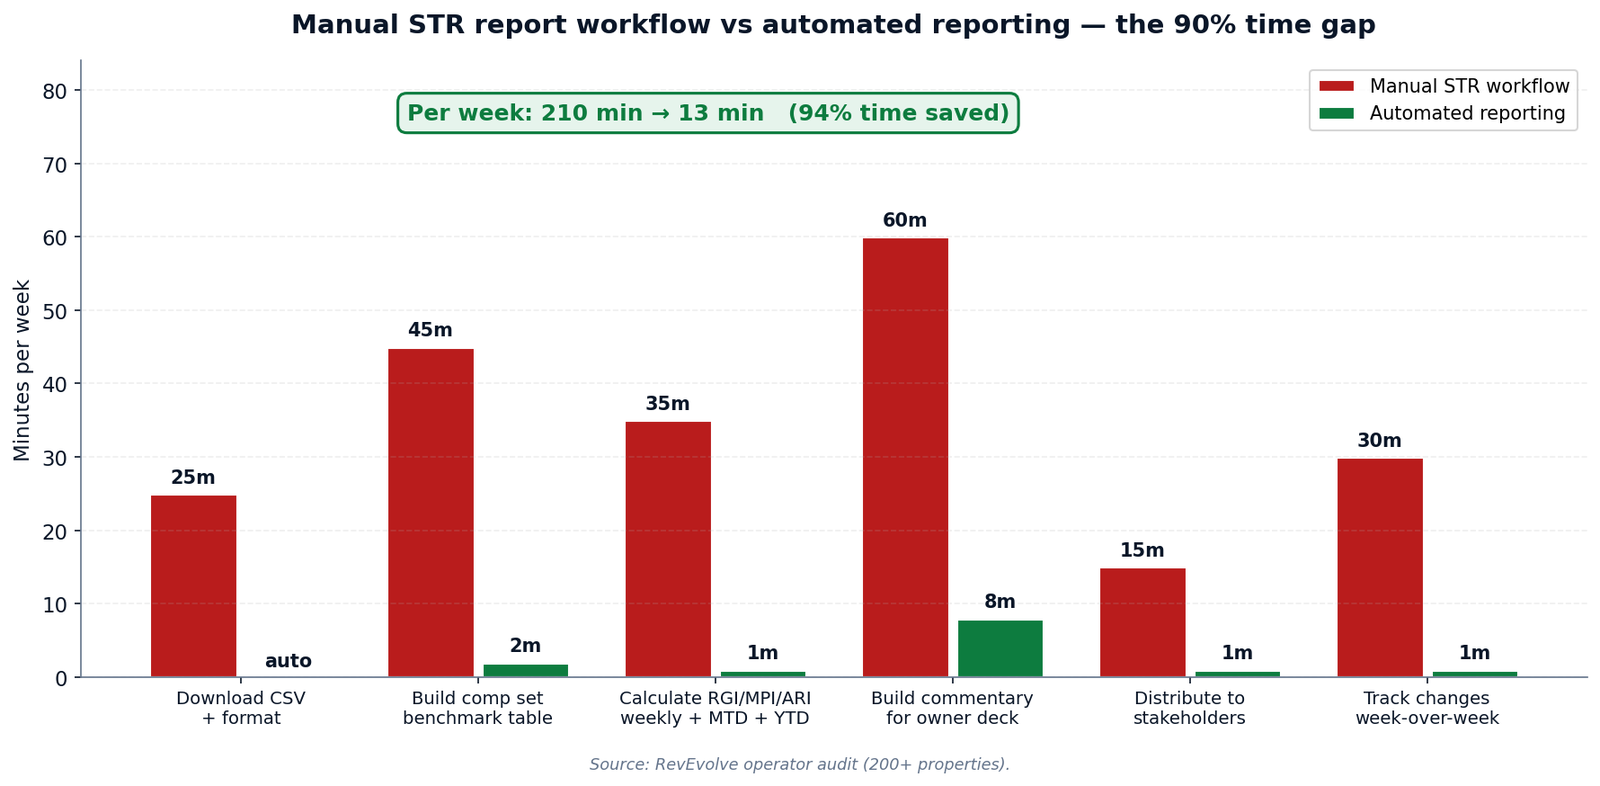
- Manual STR workflow consumes ~3 hours per revenue manager per week. Automated reporting compresses this to ~13 minutes — a 94% time saving.
- STR reports are weekly snapshots, not real-time data. Read STR alongside daily booking pace and comp set rates to close the gap between what happened and what to do about it.
→ Download the RevEvolve STR Report Template — free Google Sheets template with the RGI/MPI/ARI 5-zone framework, comp set calibration checklist, and automated commentary structure.
What Is a Hotel STR Report?
STR — Smith Travel Research, founded 1985, acquired by CoStar Group in 2019 — is the dominant hotel benchmarking dataset globally. An STR report is the weekly (or monthly, or YTD) deliverable that compares your hotel’s performance to a self-selected comp set (typically 4–7 nearby properties) across rate, occupancy, and revenue metrics. Hotels submit their data to STR; STR aggregates competitor data anonymously and returns the benchmarked report.
The report is structured around three core indices, all calculated the same way:
- RGI — Revenue Generating Index. (Your RevPAR ÷ Comp set RevPAR) × 100. The headline metric.
- MPI — Market Penetration Index. (Your occupancy ÷ Comp set occupancy) × 100. Tells you if you’re winning on volume.
- ARI — Average Rate Index. (Your ADR ÷ Comp set ADR) × 100. Tells you if you’re winning on rate.
STR reports are descriptive — they tell you what happened. The mistake most operators make is reading them passively, like a news report, instead of running them through a decision framework. The report is data; the framework is what turns data into action.
How to Read RGI — The 5 Decision Zones
Most operators glance at RGI and feel good if it’s above 100, bad if it’s below. That’s not enough resolution to drive decisions. The 5-zone framework gives every RGI reading a specific action:
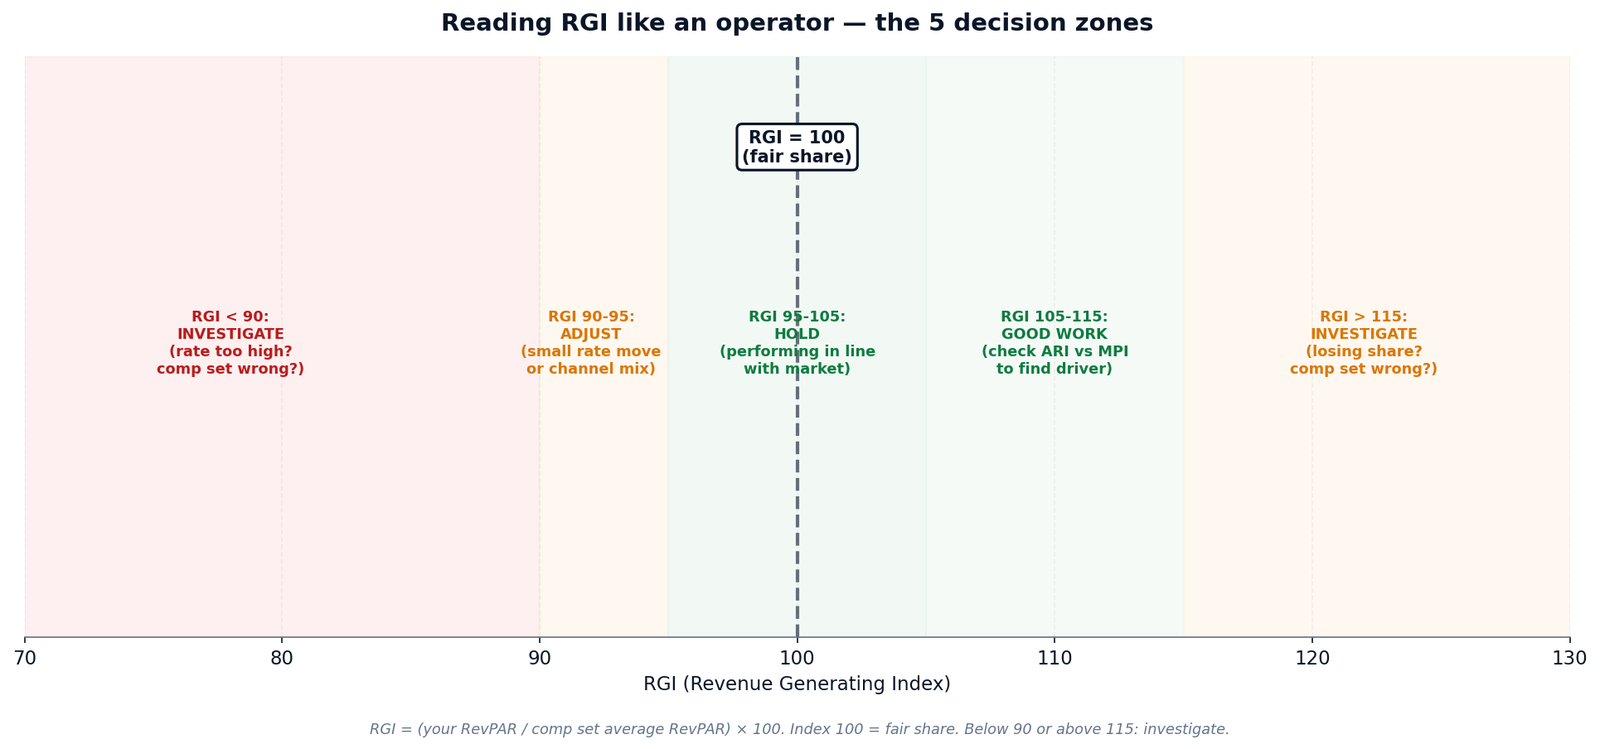
| RGI band | Interpretation | Recommended action |
|---|---|---|
| Below 90 | Significantly underperforming — rate too high vs market, comp set is wrong, or distribution gap | INVESTIGATE: check comp set calibration, audit channel mix, compare ARI vs MPI to identify the lever |
| 90 – 95 | Slight underperformance — small correction needed | ADJUST: small rate decrease (1–3%) or channel mix rebalance; recheck in 14 days |
| 95 – 105 | Performing in line with market — fair share | HOLD: no immediate action; continue regular optimization |
| 105 – 115 | Outperforming — winning share at premium | GOOD WORK: check ARI vs MPI to identify which lever drove the lift; sustain |
| Above 115 | Significantly outperforming — verify it’s real | INVESTIGATE: comp set may be too soft (drift); verify with on-the-ground rate-shopping |
Why "above 115 = investigate" matters
Most operators see RGI 120 and celebrate. Sometimes that’s warranted. More often, RGI 120 means your comp set has drifted: a member repositioned downward, closed a wing, or simply lost share. You haven’t outperformed; the comp set has under-performed, and you’re measuring against a softer benchmark. The "win" is a measurement artifact, not real share gain.
The MPI × ARI Diagnostic Matrix — The Core of STR Analysis
Two properties with an identical RGI of 105 can be in completely opposite operational situations. RGI alone tells you that you’re ahead; the MPI × ARI matrix tells you why — and what to do next.
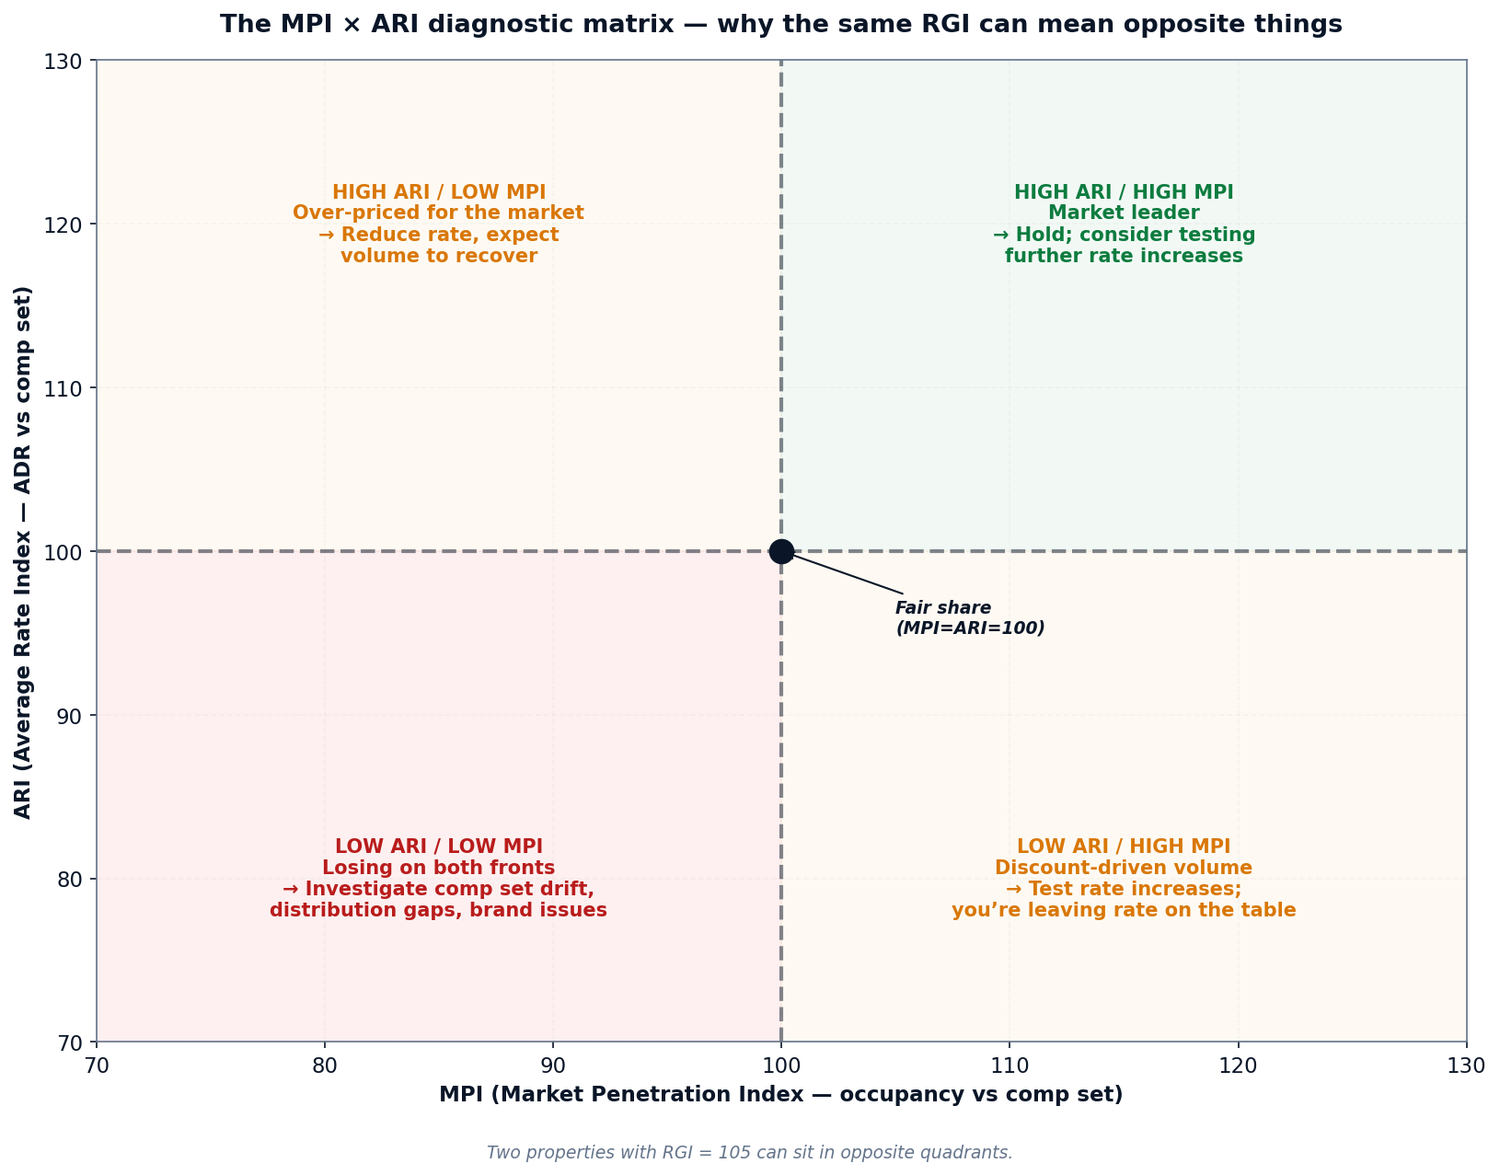
Quadrant 1 — High ARI / Low MPI (over-priced)
You’re charging more per room than the comp set, but selling fewer rooms. The classic over-pricing pattern. Often the result of: an aspirational rate strategy without market support, an eroded brand premium, comp set drift in the wrong direction (cheaper properties added that pull the ARI comparison up), or a stale rate ladder that hasn’t adapted to market softening.
Quadrant 2 — High ARI / High MPI (market leader)
You’re winning on both rate and volume — the strongest position in the matrix. Usually a brand premium paired with operational excellence, a unique product (rooftop, view, location), or a superior distribution mix.
Quadrant 3 — Low ARI / Low MPI (compounding underperformance)
You’re losing on both fronts: cheaper than the comp set and lower occupancy. The most expensive quadrant. Usually a sign of comp set drift, a distribution gap, a brand or property issue (poor reviews, dated rooms), or an operational problem.
Quadrant 4 — Low ARI / High MPI (discount-driven volume)
You’re selling more rooms than the comp set, but at lower rates. Common in OTA-heavy distribution, deep loyalty discounting, or properties trained on aggressive promotions. RevPAR can still be acceptable, but margin and brand positioning erode over time.
Walking Through an STR Report — Section by Section
A typical weekly STR report contains 6–8 sections beyond the headline indices. Most operators read the first section and stop. Here’s what each section tells you and which decisions it should drive:
| STR section | What’s in it | Decision it drives |
|---|---|---|
| Subject summary (page 1) | Your occupancy, ADR, RevPAR for the week + MTD + YTD | Top-line health check vs your own last year |
| Comp set summary | Same metrics, averaged across comp set members (anonymized) | Calibration check — does the comp set match your true competitive segment? |
| Index report (RGI/MPI/ARI) | The 3 indices weekly + MTD + YTD | The 5-zone decision framework + matrix diagnostic |
| Day of week analysis | Indices broken out by day of week | Identify weekday vs weekend pattern shifts; rate fence calibration |
| Market segment report | Performance by transient / group / contract segment | Segment-specific pricing strategy; group acceptance discipline |
| Forecast / pace report | 90-day forecast indices vs comp set | Forward-looking rate adjustments; distribution mix planning |
| Lost business (if subscribed) | RFP/group inquiries lost vs won | Group sales discipline; rate competitiveness on group business |
| Year-over-year analysis | Index trend over 13 months | Detect comp set drift; identify share gain/loss patterns |
The "weekend index pattern" — a high-leverage read
The day-of-week section is the most under-utilized part of most STR reports. The high-leverage read: if your RGI is 105 on weekdays but 92 on weekends, your weekend pricing strategy has a structural problem — rate fence not aggressive enough, weekend leisure mix too heavy on OTAs, premium not captured on peak demand. The fix is weekend-specific BAR ladders plus a 2-night minimum on peak Saturdays.
The reverse pattern — RGI 95 on weekdays, 110 on weekends — usually signals a corporate/business mix gap on weekdays. The fix: GDS optimization, corporate negotiated rate review, weekday loyalty member rates.
Comp Set Drift — The #1 STR Report Failure Mode
A comp set selected 18 months ago is almost certainly wrong today. Comp set drift is the silent killer of STR-driven decision quality — because the math stays correct, but the benchmark stops being relevant. You can outperform a wrong comp set by 15% and still lose share to your true competitive set.
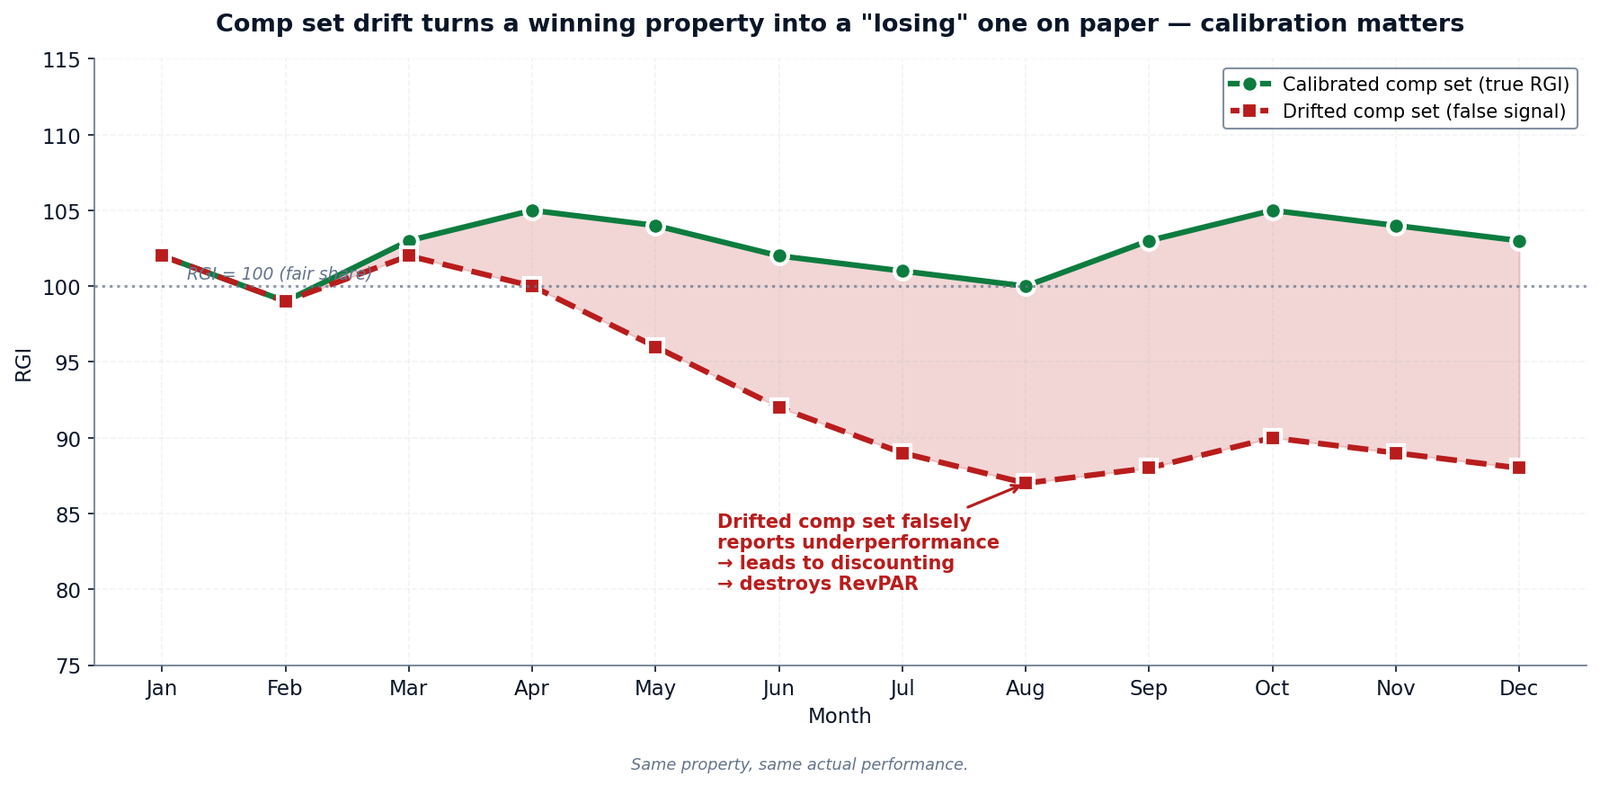
How comp sets drift
- A comp set member repositions — renovates rooms, raises ADR by 20%, jumps a market segment.
- A comp set member declines — dated product, falling reviews, ADR sliding.
- A comp set member closes for renovation, conversion, or permanently.
- New entrants arrive — a hotel opens within 1.5 km of yours but isn’t in your comp set.
- Your own property repositions — you renovated, raised ADR, captured a new segment.
The quarterly comp set calibration check
Every quarter, run this 4-step check on every comp set member:
- Is their average ADR within ±20% of yours? If consistently 30%+ higher or lower, they’re not in your competitive band.
- Are they within 2 km (urban) or 15 km (resort) of your property? Geographic substitution matters.
- Is their product class within ±1 star tier? A 4-star and a 2-star don’t compete for the same guest.
- Do you actually lose bookings to them? The strongest test — ask front desk and reservations. The hotels guests substitute toward are your true comp set, regardless of what the spreadsheet says.
Comp set drift is a 30-minute quarterly fix that prevents 12 months of misdirected pricing. Most properties skip it because nothing operationally forces it. The discipline is putting it on the calendar like a financial close.
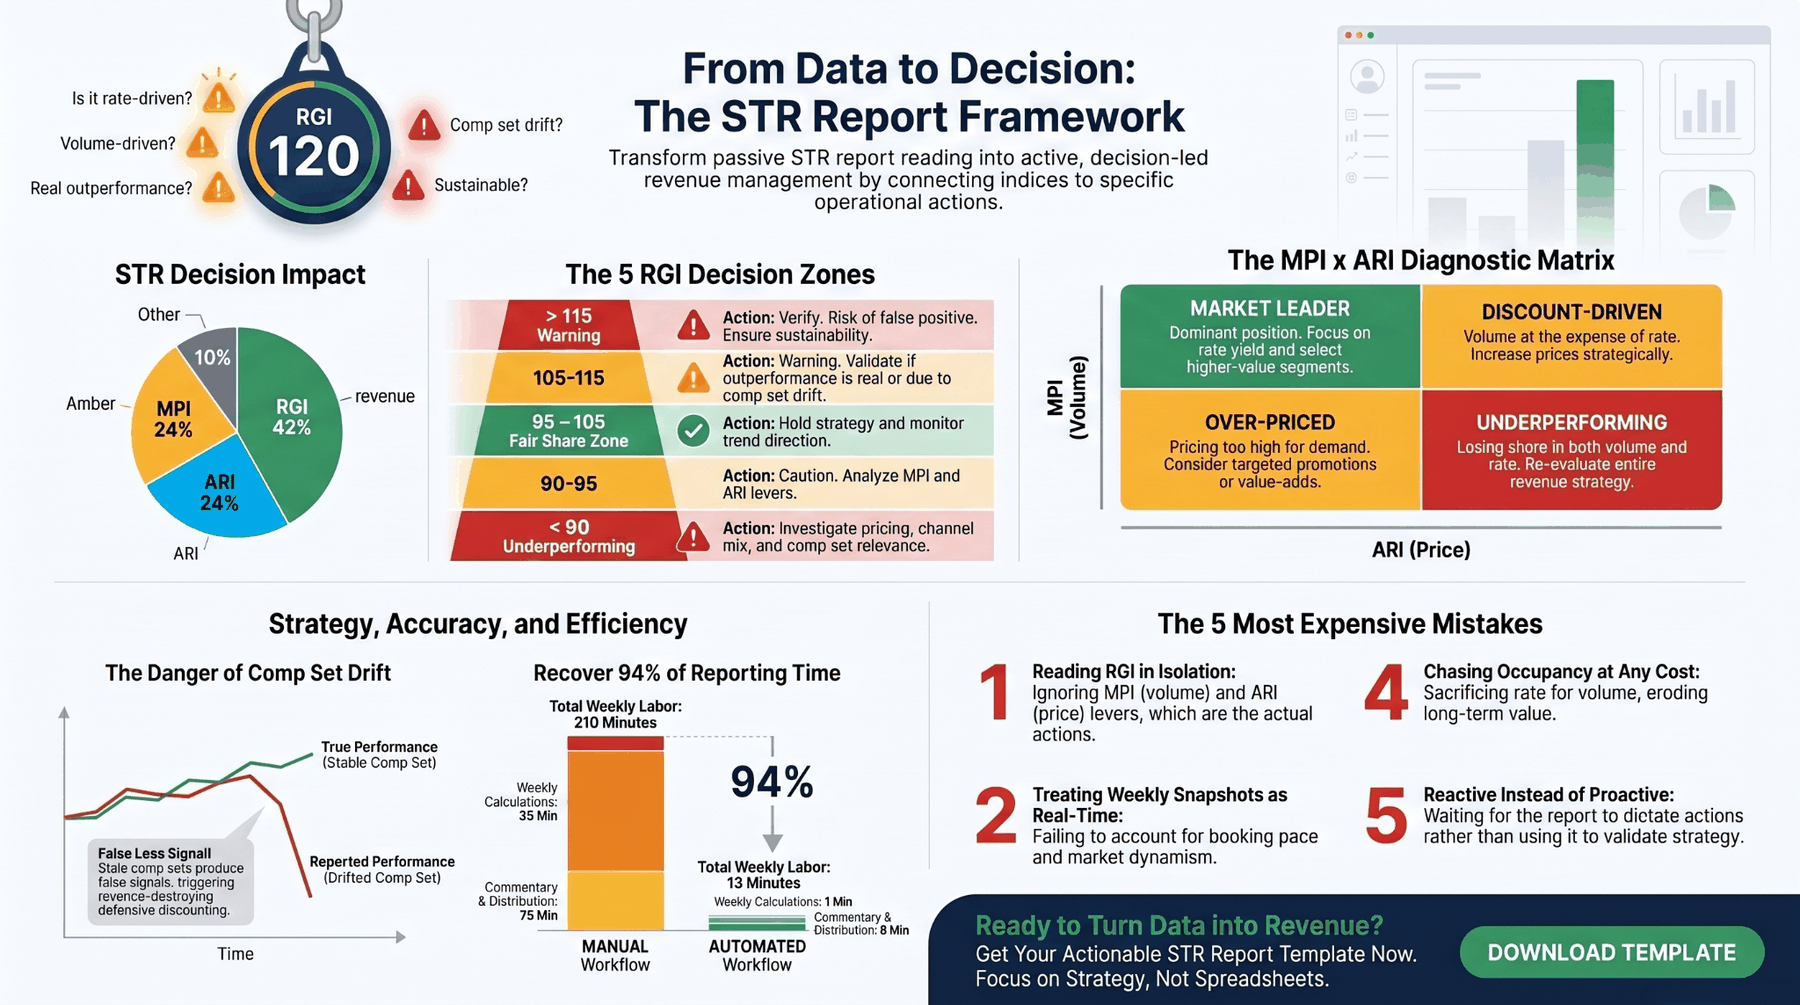
From Manual STR Workflow to Automated Reporting
A typical revenue manager spends 3 hours per week on the STR reporting workflow: download the report, format it in Excel, calculate period-over-period changes, build commentary for the owner deck, distribute. That’s 156 hours per year per RM — close to four full work weeks of pure data-handling labour.
| Workflow task | Manual | Automated | Time saved |
|---|---|---|---|
| Download CSV/PDF + format in Excel | 25 min | Auto | 100% |
| Build comp set benchmark table | 45 min | 2 min | 95% |
| Calculate RGI / MPI / ARI weekly + MTD + YTD | 35 min | 1 min | 97% |
| Build commentary for owner deck | 60 min | 8 min | 87% |
| Distribute to stakeholders | 15 min | 1 min | 93% |
| Track changes week-over-week | 30 min | 1 min | 97% |
| TOTAL per week | 210 min | 13 min | 94% |
Reporting requires too much manual work, and training new staff takes forever. Things like "advanced rate management" sound impressive in demos but you never actually touch them once it’s implemented.
What the freed time gets used for
The 197 minutes per RM per week saved compound to ~170 hours per year of recovered capacity. Properties typically reallocate that toward:
- Quarterly comp set calibration audits — the discipline that prevents drift in the first place
- Daily booking pace and pickup analysis — the decisions automated reporting can’t make for you
- Strategic projects: segment expansion, channel mix optimization, ancillary revenue programs
- Sales and marketing alignment meetings that previously got skipped
- Multi-property operations — automated reporting is what enables 22+ properties per RM
The 5 Most Expensive Mistakes in STR Report Reading
Mistake 1 — Reading RGI as a single number, ignoring MPI and ARI
RGI 105 looks like a win regardless of source. But RGI 105 driven by ARI 115 and MPI 91 is over-pricing dressed up as outperformance — the volume is bleeding. The same RGI driven by MPI 110 and ARI 95 is healthy share gain. Two situations that require opposite actions.
Mistake 2 — Skipping comp set calibration
A comp set selected 18+ months ago is almost certainly wrong today. Without quarterly calibration, the report produces correct math against a stale benchmark — false signals that trigger wrong decisions.
Mistake 3 — Treating STR as real-time data
STR reports are weekly snapshots with a 1–3 day data lag. By the time the report shows underperformance, the cause has usually been operating for 7–10 days.
Mistake 4 — Celebrating RGI above 115 without verifying
RGI above 115 is sometimes real outperformance, but more often a measurement artifact — the comp set softened, repositioned downward, or had a member close. Acting on the false win compounds into bad decisions later.
Mistake 5 — Using STR reports for owner reporting without context
STR is a competitive benchmark, not a profit metric. An owner reading RGI 110 thinks the property is winning. The owner reading the same week’s GOPPAR down 4% gets the truth.
Conclusion — Read the Report, Then Use It
STR reports have been the hotel benchmarking standard for 40 years. Most operators read them weekly. Few operators turn them into decisions consistently. The gap between reading and using is where the value sits — the 5-zone RGI framework, the MPI × ARI diagnostic matrix, the quarterly comp set calibration discipline, and the owner-report context that pairs STR with GOPPAR.
Properties that build the discipline see two compounding outcomes: a 94% reduction in weekly STR workflow time (when paired with automated reporting), and meaningfully better pricing decisions — because the diagnostic matrix prevents the most common errors. The math has been the same for 40 years; what changes is the operator’s ability to act on it.
It takes forever to train new staff, reporting is terrible, no mobile access, integrations don’t work properly. Specifically interested in hearing about training time, support quality, and whether integrations actually work as advertised.
Stop downloading STR PDFs. Start automating the workflow.
- → Download the RevEvolve STR Report Template — free Google Sheets template with the RGI/MPI/ARI 5-zone framework, comp set calibration checklist, and automated commentary structure.
- → See RevEvolve’s Automated Reporting in action — STR data integrated with PMS, channel manager, and AI demand forecasting; auto-generated weekly reports with plain-English commentary. 15-minute walkthrough.