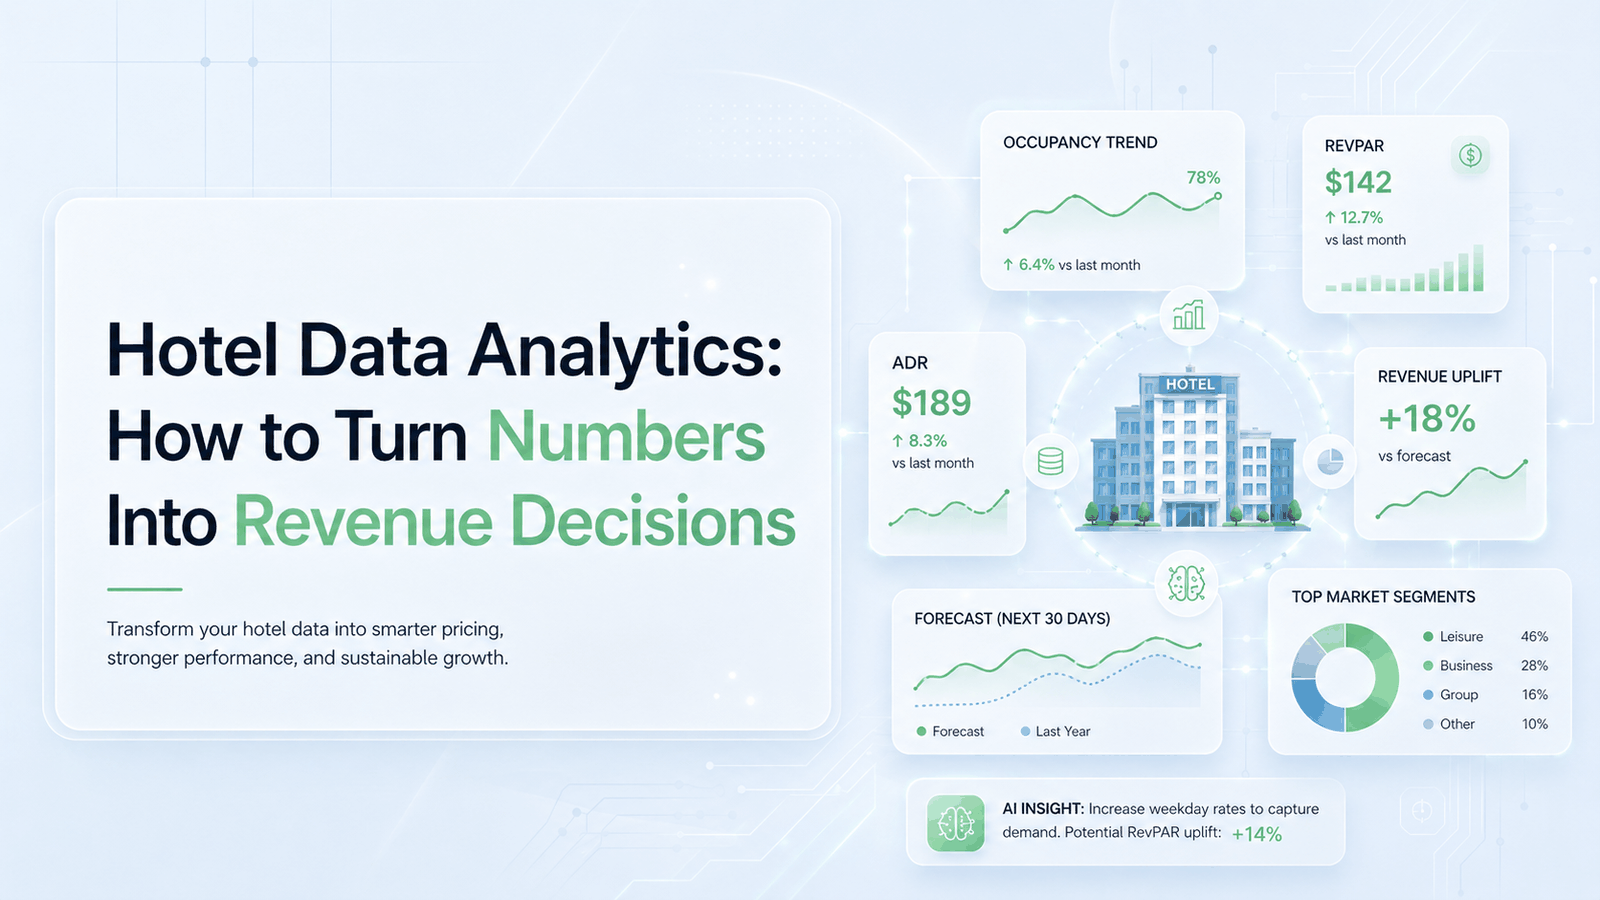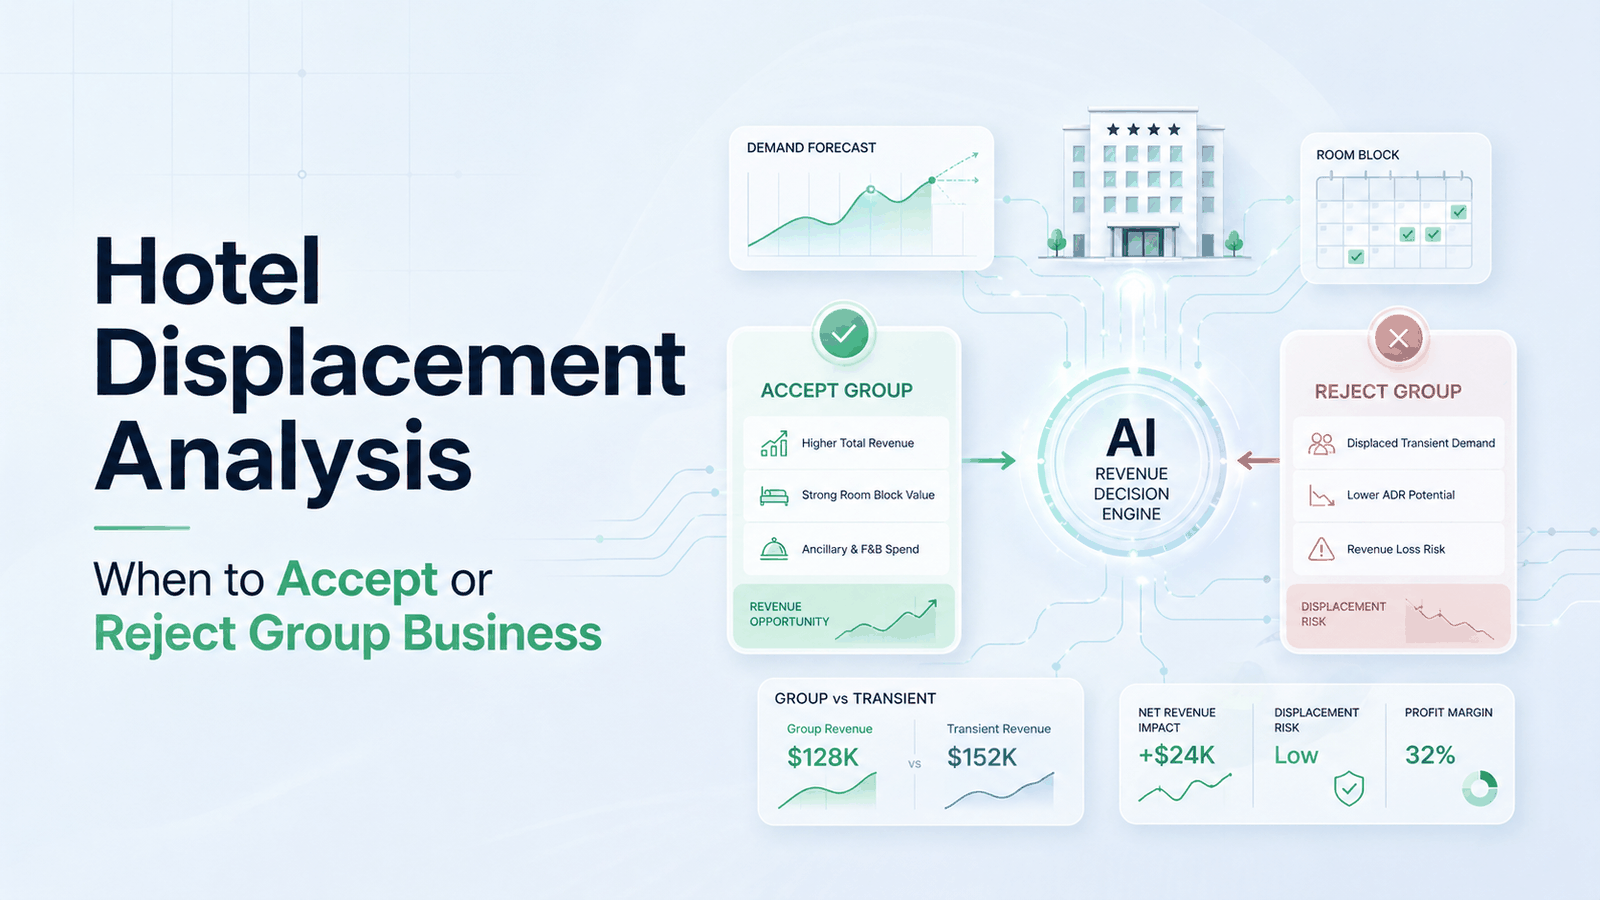
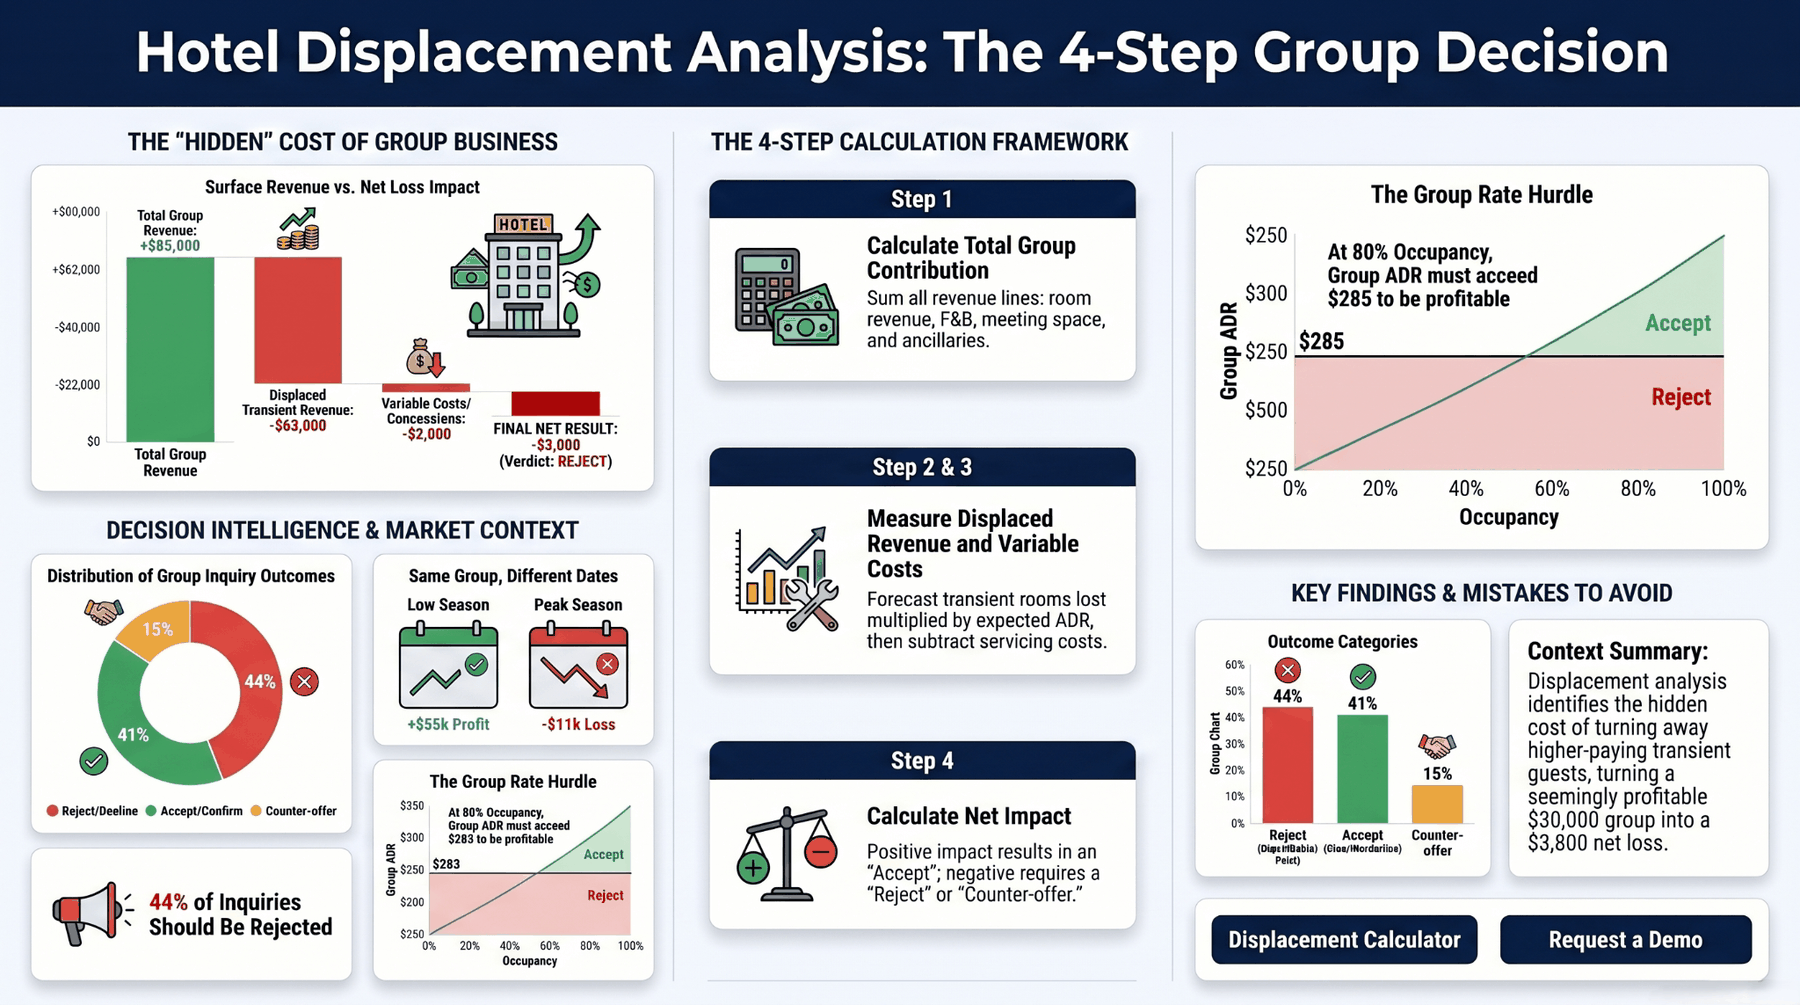
SNIPPET DEFINITION — Hotel displacement analysis is the calculation that determines whether to accept or reject a group booking by comparing the group’s total revenue against the transient revenue the hotel will lose by giving up those rooms. The 4-step calculation is: (1) total group revenue (rooms + F&B + ancillary), (2) displaced transient demand (forecasted occupancy on group dates), (3) displacement cost (displaced rooms × forecasted transient ADR + lost F&B), (4) net contribution (group revenue minus displacement cost minus group variable cost). Accept if positive; reject if negative. Applied properly, ~30–40% of group inquiries that "feel" profitable get rejected; ~25% get accepted on different dates or terms via counter-offer.
Key takeaways
- Most operators eyeball group decisions: "rooms are sold, F&B revenue covers the discount, accept it." This produces ~30–40% unprofitable group bookings on properties without displacement discipline.
- The 4-step calculation: Group Revenue (rooms + F&B + ancillary) → Displaced Demand (forecasted transient occupancy) → Displacement Cost (displaced rooms × transient ADR) → Net Contribution. Accept if positive.
- The same group offer flips from accept to reject as forecasted transient occupancy crosses ~50%. Below 50%: accept. Above 80%: reject. In between: counter-offer.
- The hurdle rate is the minimum group ADR at which net contribution ≥ 0 after displacement. At 80% forecasted occupancy, the hurdle for a $260 transient ADR property is ~$285 group ADR — above the typical group offer.
- Counter-offering is often the right answer: ~15% of inquiries that fail at requested dates become profitable on shoulder dates or with an adjusted block size.
- F&B and ancillary revenue change the math significantly. A wedding block at $180 group ADR is unprofitable on its own at peak demand — but with $250/room F&B contribution, the same block becomes accept-worthy. The math has to be complete.
→ Try the RevEvolve Displacement Calculator — free interactive tool: enter group ADR, room block, dates, and forecasted occupancy; get an accept/reject verdict with the full math breakdown.
What Is Hotel Displacement Analysis?
Hotel displacement analysis is the discipline of evaluating a group booking inquiry against the transient business it will displace. The fundamental question: when this group takes 50 rooms on a peak Saturday at $180 ADR, how much higher-paying transient demand are we turning away? If the displaced transient revenue exceeds the group revenue, the "profitable group" is actually a loss disguised as a sale.
The discipline matters most on three types of dates:
- Peak demand dates — weekends in season, event weekends, holiday periods. Forecasted transient occupancy is high; displacement is severe; group rates need to be competitive with peak transient ADR.
- Compression dates — city-wide events (concerts, conferences, sports). Hotels run sold out at maximum ADR; accepting group business at discount leaves meaningful revenue on the table.
- Borderline dates — mid-season weekends, holiday-adjacent dates. The math is closer; intuition fails; the explicit calculation is what determines profitability.
On low-demand dates (off-peak weekdays, deep shoulder season), displacement is near-zero — because the displaced transient demand wasn’t coming anyway. Group business at any reasonable rate is incremental revenue. The discipline still applies, but the answer is almost always accept.
The eyeball method ("we’ll fill those rooms anyway, take the group") fails most on the dates where being right matters most. On Tuesday in February, eyeball is fine — the math agrees. On Saturday during a city-wide event, eyeball is wrong by tens of thousands of dollars per group, and those errors compound across the year.
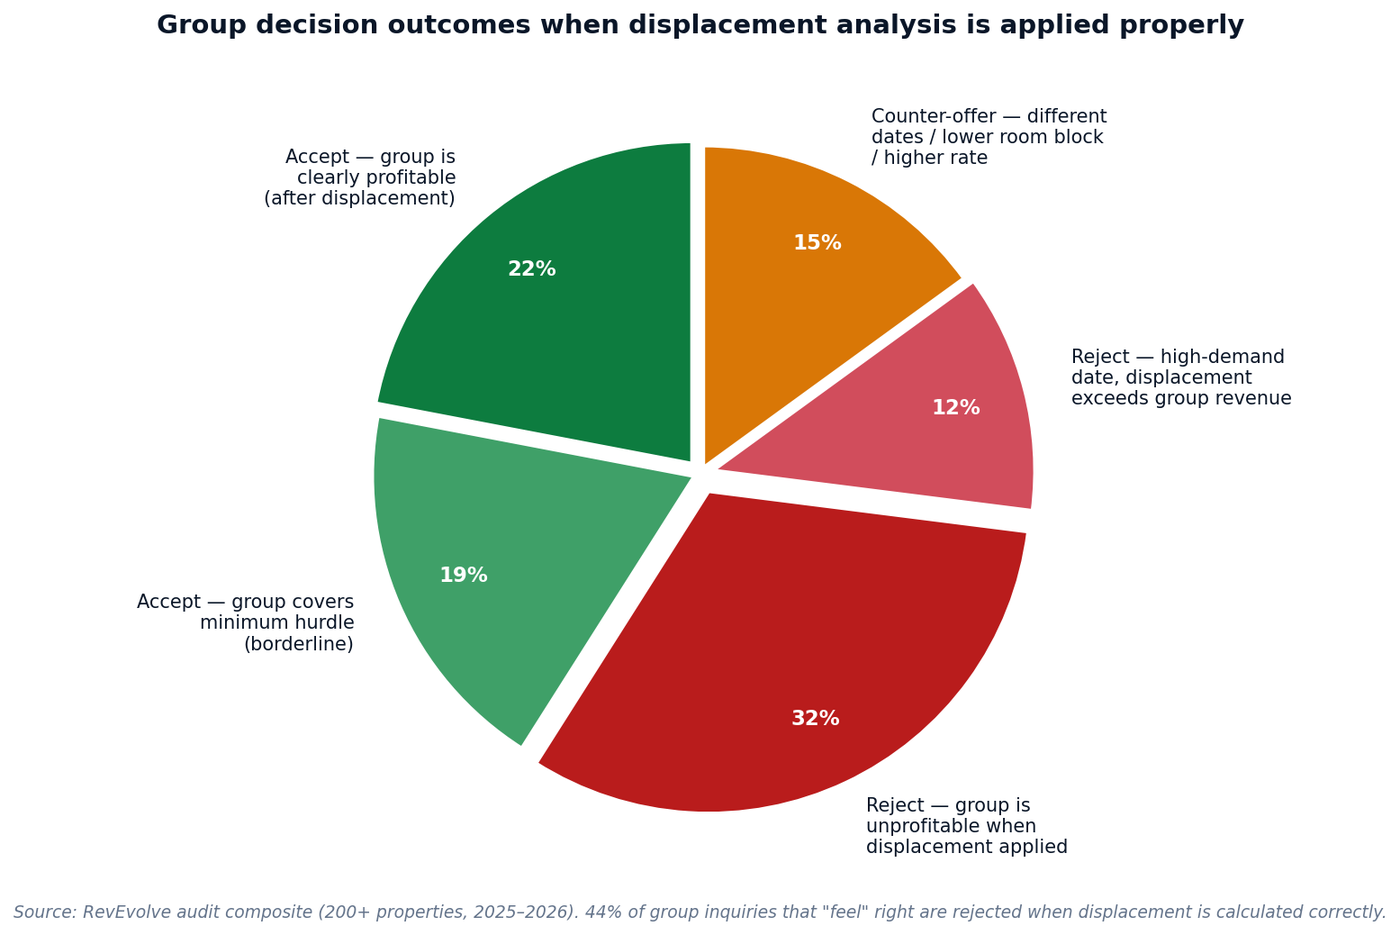
Group Decision Outcomes With Proper Displacement Analysis
When displacement analysis is applied to every inquiry, group decisions distribute across 5 outcome categories — not just accept/reject. Most operators converge on this distribution within 2–3 quarters of disciplined practice:
| Outcome | Share | When it occurs | Action |
|---|---|---|---|
| Clear accept | 22% | Off-peak dates, mid-tier ADR offers, strong F&B | Confirm at requested rate |
| Borderline accept | 19% | Mid-demand dates, marginal hurdle clearance | Accept with attached F&B minimum |
| Unprofitable reject | 32% | Peak dates, group ADR below hurdle, weak F&B | Decline politely; offer alternative dates |
| Peak-demand reject | 12% | Sold-out forecast, no displacement headroom | Decline; do not counter-offer same dates |
| Counter-offer | 15% | Wrong dates / wrong block size / fixable rate gap | Propose alternative: dates, block, ADR, F&B |
My biggest pet peeve in all my years of hotel sales is wedding blocks. Unless you are Greek, Indian or Italian, they never pick up. No one wants to pay for a room overnight for your wedding in the middle of a city that isn’t also a tourist area. They will book a room with Aunt Lisa and Uncle Jim or share a room with as many people as possible. Yes, even if 75% of your guests are from out of town. So please stop asking for 50–100 rooms. You won’t need them.
That insight applies directly to displacement: wedding blocks frequently fail to pick up at promised volume — yet the rooms are held against transient demand for the contract period. The displaced revenue is lost; the group revenue never materializes. This is why every group contract should specify (1) an attrition clause (penalty for unfilled rooms), (2) a cut-off date (when unfilled inventory releases back to transient), and (3) a minimum F&B commitment.
The 4-Step Displacement Calculation
Every group inquiry, every time, runs through the same 4-step calculation. It takes ~3 minutes per inquiry once the inputs are in a calculator; the discipline is doing it consistently, not the math itself.
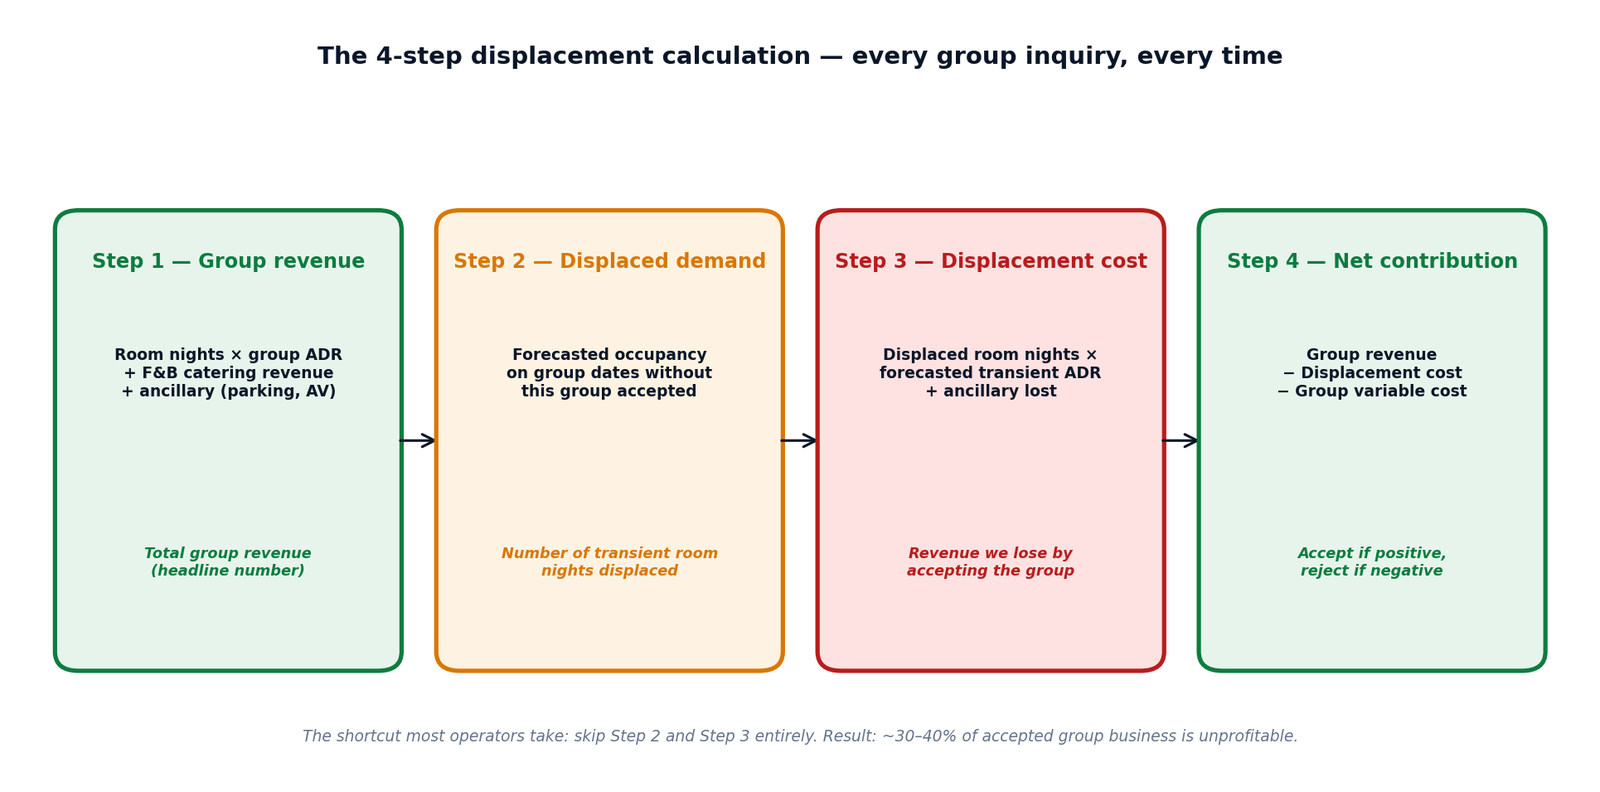
Step 1 — Calculate total group revenue
Sum every revenue line the group will generate, not just rooms:
| Revenue line | Formula | Worked example |
|---|---|---|
| Room revenue | Room nights × group ADR | 50 rooms × $180 = $9,000/night |
| F&B catering | Headcount × catering rate per head | 120 ppl × $150 = $18,000 |
| Banquet / event space | Day rate or % of F&B minimum | $2,500 ceremony fee |
| Audio-visual / equipment | Per-day equipment rental | $1,000 AV bundle |
| Parking | Vehicles × daily rate | 40 vehicles × $30 = $1,200 |
| Spa / amenity package | Bookings × service rate | Optional add-on |
| TOTAL | Sum of all lines | $31,700 (1-night example) |
Step 2 — Calculate displaced transient demand
On the group dates, what would forecasted transient occupancy have been without the group?
- Pull forecasted transient demand for the group dates (from your RMS, BI dashboard, or AI demand forecast).
- If forecasted occupancy is 80% on a 100-room property and the group requests 50 rooms — the full group block displaces (50 rooms).
- If forecasted occupancy is 50% (50 rooms) and the group requests 50 rooms — displaced transient is exactly 50 rooms.
- If forecasted occupancy is 30% (30 rooms) and the group requests 50 rooms — displaced transient is 30 rooms; the rest is incremental, not displaced.
Step 3 — Calculate the displacement cost
Multiply displaced transient room nights by what those nights would have produced:
| Cost line | Formula | Worked example |
|---|---|---|
| Displaced room revenue | Displaced rooms × forecasted transient ADR | 50 × $260 = $13,000/night |
| Displaced F&B (transient) | Displaced rooms × F&B per occupied room | 50 × $35 = $1,750 |
| Displaced ancillary | Displaced rooms × ancillary per room | 50 × $10 = $500 |
| TOTAL DISPLACEMENT COST | Sum of displaced lines | $15,250 per night |
Step 4 — Calculate net contribution
| Component | Formula | 1-night example |
|---|---|---|
| (+) Total group revenue | Step 1 sum | +$31,700 |
| (−) Total displacement cost | Step 3 sum | −$15,250 |
| (−) Group variable costs | Housekeeping + amenities + commission | −$2,800 |
| NET CONTRIBUTION | Final number | +$13,650 |
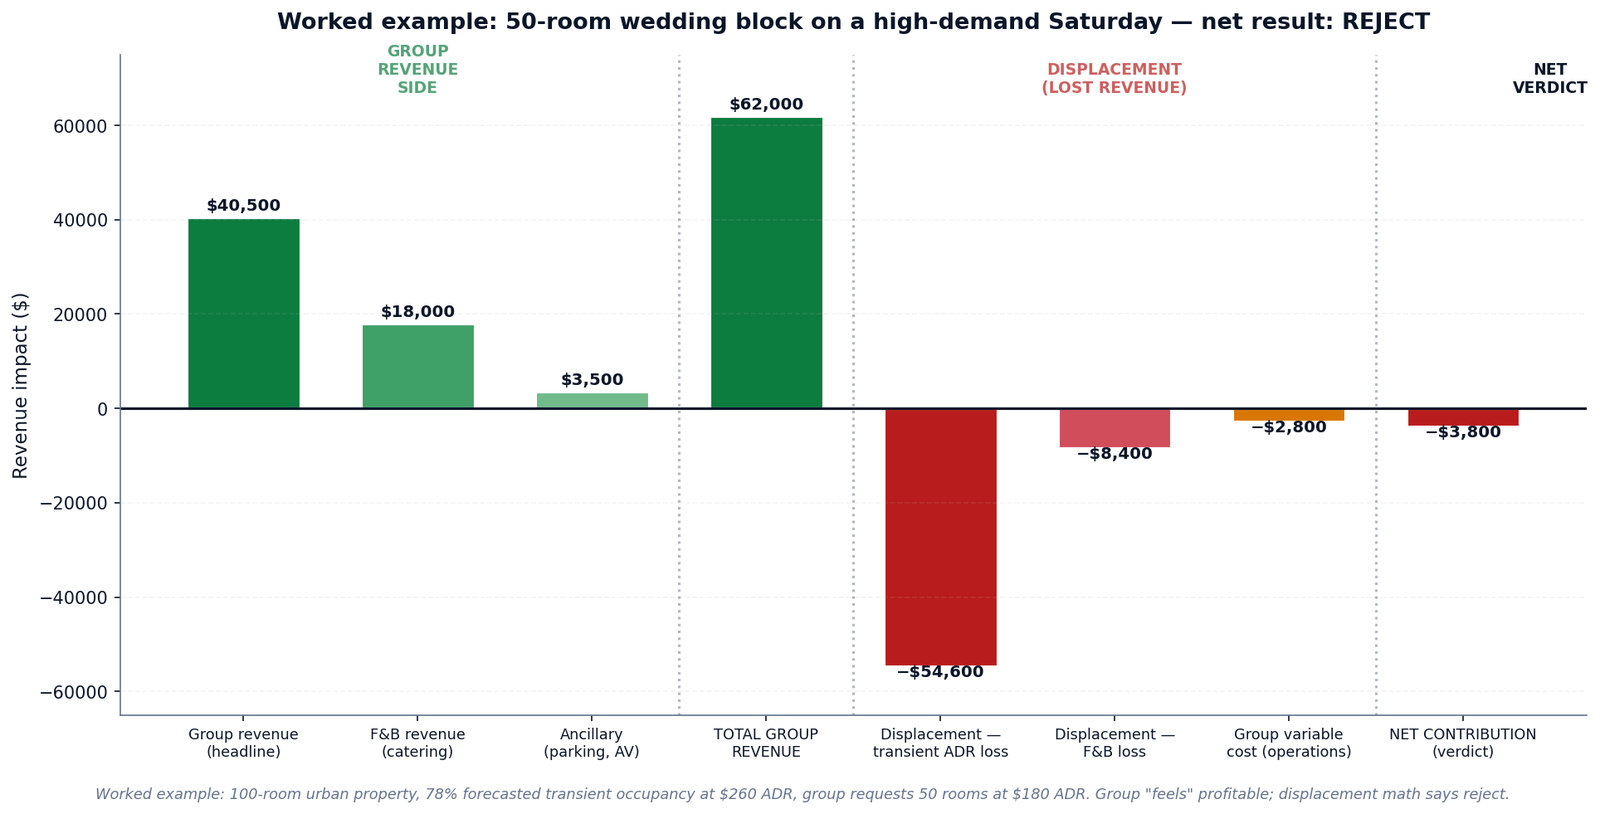
Worked Example: 50-Room Wedding Block on a Peak Saturday
A 100-room urban property gets an inquiry: 50-room wedding block, one Saturday night in October, group ADR $180, 120-person reception with $150/head catering. Forecasted transient occupancy on that Saturday: 78% at $260 ADR.
The eyeball verdict: "Accept — $9k room revenue + $18k catering + parking = $30k+ revenue, of course we take it."
What the counter-offer looks like
A $3,800 negative net contribution can be flipped to positive with one of these adjustments:
- Move to shoulder season (forecast transient occ 50% instead of 78%) → displacement drops ~$30k → net contribution becomes ~+$26k
- Reduce room block from 50 to 30 (more realistic given wedding pickup patterns) → displacement drops 40% → net contribution becomes ~+$22k
- Increase group ADR from $180 to $245 → covers the displacement gap → net contribution becomes ~+$3k
- Add an F&B minimum of $35,000 (vs $30,000 in the original quote) → incremental F&B revenue covers the gap
In practice, properties offer the wedding planner 2 of these 4 adjustments and let them choose. ~40% of counter-offers convert into accepted business at the new terms.
The Same Group Offer, Different Demand Contexts
Displacement is not a property of the group offer — it’s a property of the dates the group wants. The same 50-room wedding block at $180 ADR can be highly profitable or deeply unprofitable depending on what would have happened on those dates without the group.
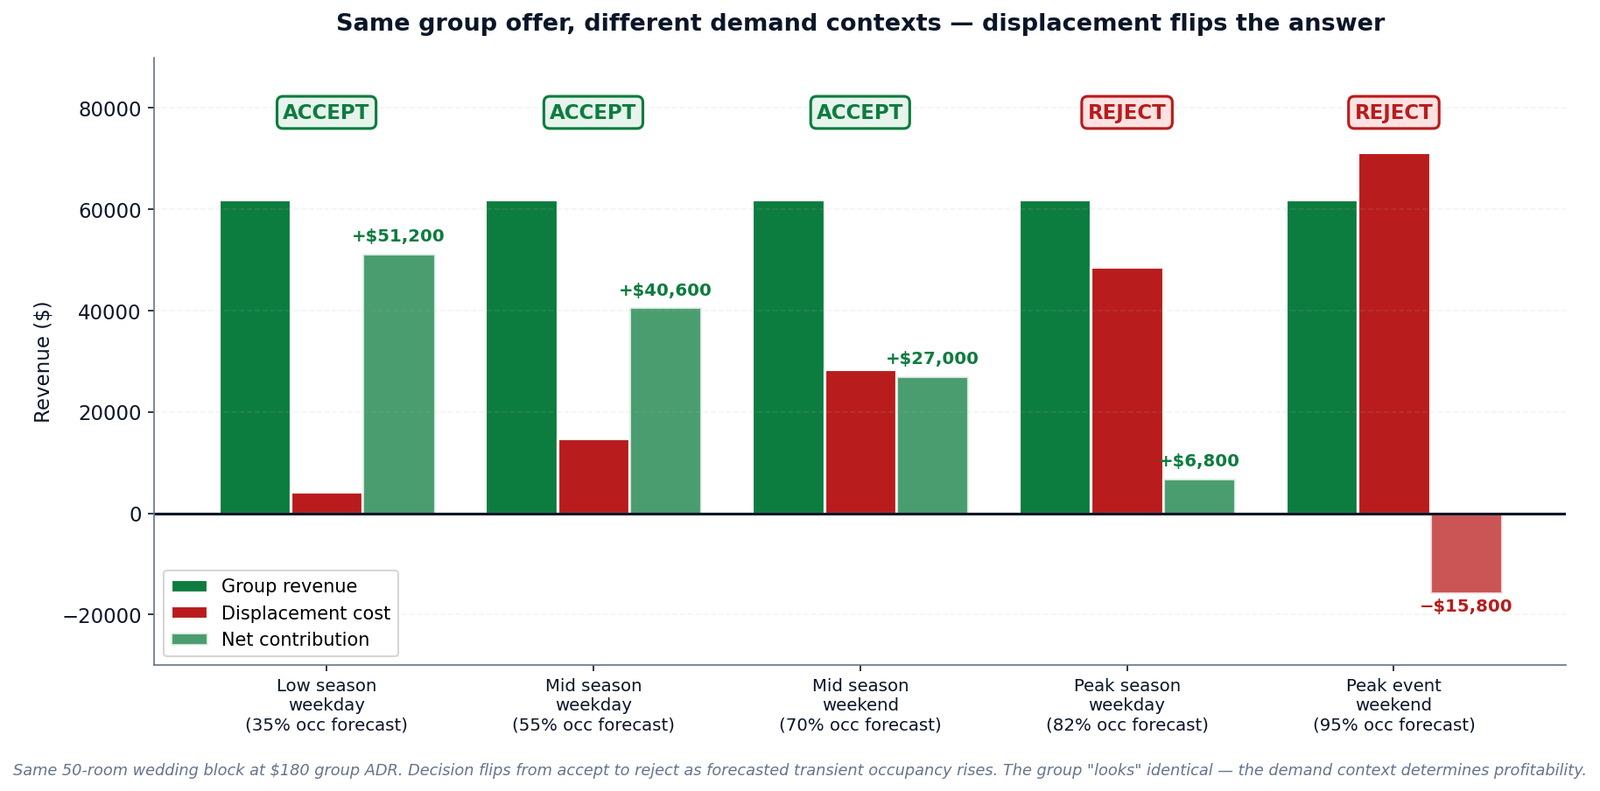
| Forecast scenario | Group revenue | Displacement cost | Net contribution | Verdict |
|---|---|---|---|---|
| Low season weekday (35% occ) | +$62,000 | −$4,200 | +$55,400 | ACCEPT |
| Mid season weekday (55% occ) | +$62,000 | −$14,800 | +$45,200 | ACCEPT |
| Mid season weekend (70% occ) | +$62,000 | −$28,400 | +$31,600 | ACCEPT |
| Peak season weekday (82% occ) | +$62,000 | −$48,600 | +$13,400 | BORDERLINE |
| Peak event weekend (95% occ) | +$62,000 | −$71,200 | −$11,800 | REJECT |
The pattern: displacement scales non-linearly with forecasted occupancy. Below 50%, displacement is minimal because most rooms wouldn’t have sold anyway. Above 80%, displacement compounds because every displaced transient was a high-rate booking. The crossover point is property-specific but typically falls around 50–60% forecasted occupancy.
The Group Rate Hurdle — The Single Most Useful Output
The hurdle rate is the minimum group ADR at which net contribution ≥ 0, given the property’s forecasted occupancy and ADR on the group dates. Once you have the hurdle, every group inquiry is a 5-second decision: is the offered group ADR above or below the hurdle?
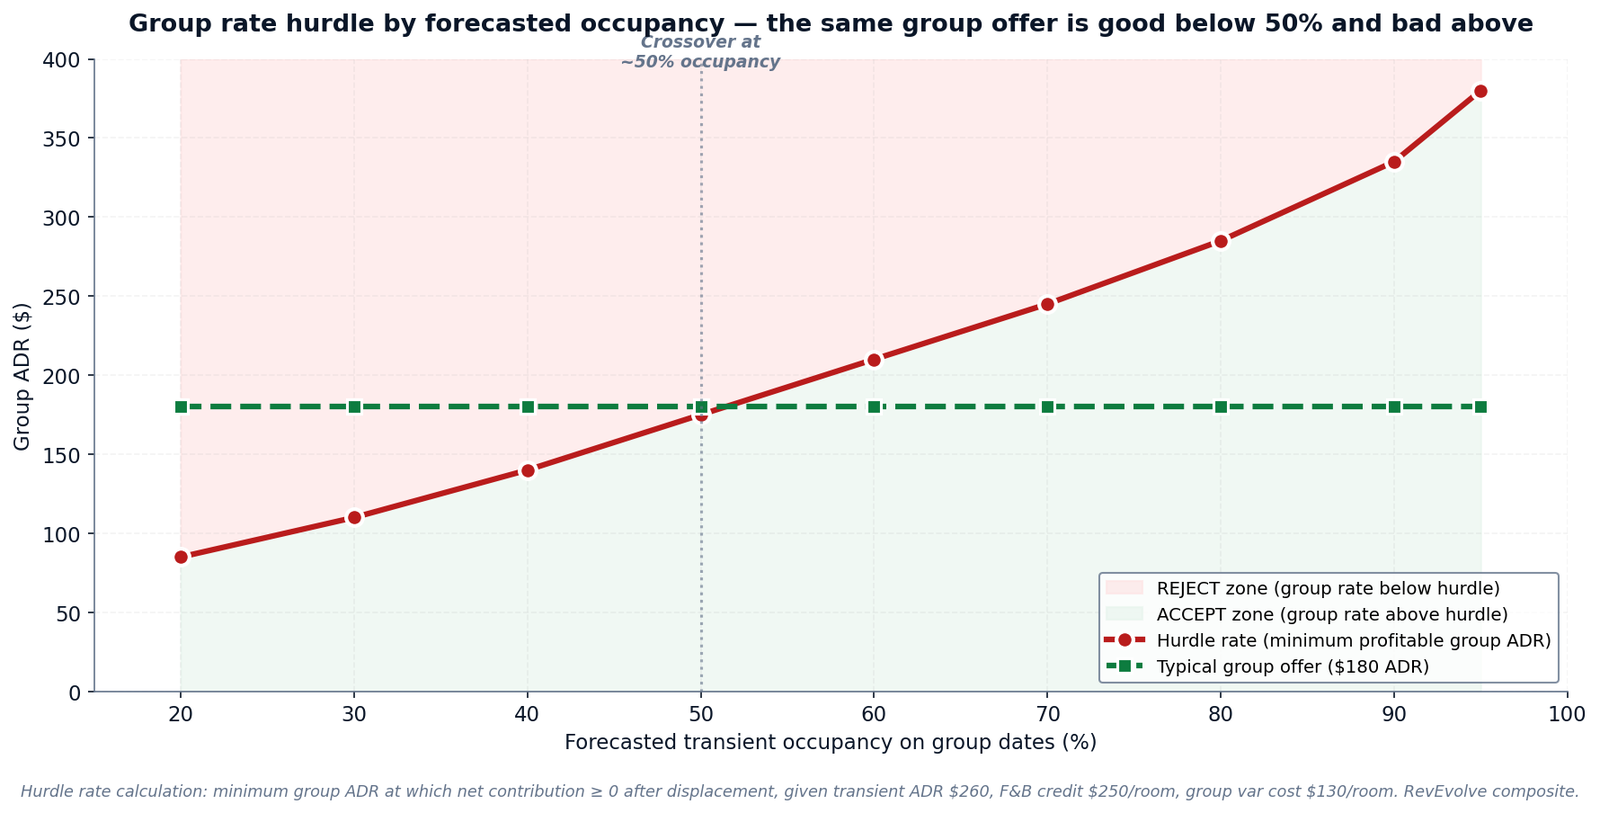
| Forecasted transient occupancy | Hurdle group ADR | Typical group offer ($180) | Verdict |
|---|---|---|---|
| 20% | $85 | $180 | Clear accept |
| 30% | $110 | $180 | Clear accept |
| 40% | $140 | $180 | Accept |
| 50% | $175 | $180 | Borderline (just above) |
| 60% | $210 | $180 | Reject (or counter) |
| 70% | $245 | $180 | Reject |
| 80% | $285 | $180 | Reject |
| 90% | $335 | $180 | Strong reject |
| 95% | $380 | $180 | Strong reject |
How to use the hurdle table operationally
- Generate a hurdle rate table per property using your transient ADR, F&B contribution per room, and variable cost assumptions. Update it quarterly.
- For every group inquiry: pull forecasted occupancy on the group dates → look up the hurdle → compare to the offered group ADR → decision in 5 seconds.
- For borderline cases (within $20 of the hurdle): run the full 4-step calculation, factoring F&B contribution explicitly.
- For dates 90+ days out: use confidence-interval forecasting — if the forecast range spans the hurdle, be conservative (counter-offer rather than commit).
The hurdle rate table is the single highest-leverage output of displacement analysis. Properties that build it once and update it quarterly make group decisions 10× faster with 30–40% better profitability. The discipline isn’t the math — it’s having the math pre-computed and trusted by the sales team.
The 5 Most Expensive Mistakes in Hotel Group Decisions
Mistake 1 — Skipping displacement analysis when "the rooms are sold anyway"
On peak weekends with high forecasted occupancy, "the rooms are sold anyway" is exactly the case where displacement is most severe. The intuition is backwards — strong demand makes displacement worse, not irrelevant. Properties accept group business on peak dates because revenue feels guaranteed, not realizing that transient demand at premium ADR was also guaranteed.
Mistake 2 — Counting only group F&B, ignoring displaced transient F&B
Group F&B is rarely fully incremental — the catering kitchen, bar staff, and meeting space were going to host transient F&B (hotel guests dining, walk-in restaurant covers). Counting group F&B as 100% incremental revenue overstates the group case and understates displacement.
Mistake 3 — Using last-year-same-day forecast for group dates
Group decisions are made 30–180 days ahead. Last-year-same-day forecasting at that horizon is wrong by 15–25%. A wrong forecast on the group dates produces a wrong displacement number and a wrong decision — typically over-accepting groups because LY underestimates current transient demand. See the predictive pricing guide.
Mistake 4 — Not requiring an attrition clause and cut-off date
Wedding blocks famously fail to pick up at promised volume — yet contracts often guarantee the rooms against transient demand for 60–90 days. The displaced transient revenue is lost (rooms held); the group revenue partially fails to materialize (block doesn’t pick up). This is the worst-of-both-worlds outcome.
Mistake 5 — Saying yes to every inquiry to "build relationships"
Sales teams compensated on group revenue volume have a structural incentive to accept every inquiry, regardless of displacement. The relationship value is real but rarely large enough to justify systematically unprofitable groups. A counter-offered "no" with a clear alternative ("let’s look at Tuesday–Thursday in March instead") preserves the relationship and the math.
Conclusion — The Discipline Is Doing the Math
Displacement analysis is not complicated math. The 4 steps fit on a calculator. The discipline is doing the math on every group inquiry, every time — especially the inquiries where intuition says accept. Properties that build the discipline see two compounding outcomes: a ~30–40% rejection rate on inquiries that previously got accepted (recovering displaced transient revenue), and ~15% counter-offer conversion (preserving relationships at terms that work for both sides).
The calculation needs three inputs: a clean group revenue model, a credible demand forecast, and a hurdle rate table. The first is straightforward. The second requires AI demand forecasting — because last-year-same-day fails at 30+ day horizons. The third is built once and updated quarterly. Nothing about this is exotic. It’s table-stakes commercial discipline that most independent properties skip because it has never been a structured part of the workflow.
Looking for reservations software that can handle complexity without requiring a PhD to operate. Needs to support packages with multiple components, enforce inventory rules, handle group bookings properly.
Stop accepting group business on intuition. Start running the math.
- → Try the RevEvolve Displacement Calculator — free interactive tool: enter group ADR, room block, dates, and forecasted occupancy; get an accept/reject verdict with the full math breakdown.
- → See Group Revenue Displacement in action — fully integrated with AI demand forecasting and per-property hurdle rate tables. 15-minute walkthrough.