SNIPPET DEFINITION — Hotel cancellation rate is the share of bookings that get cancelled — cancelled bookings divided by total bookings for a period. A no-show is a booking that never arrives and never cancels. Both are forecastable: their rates are stable by segment, channel, and lead time, so a hotel can apply historical patterns to its on-the-books reservations to predict how many rooms will actually free up.
A guest doesn’t show up. The room they booked — the one you turned three other guests away for on a sold-out night — sits empty. It was “sold,” so you never resold it, and now it’s 11pm and there’s nothing you can do. That empty room is the true cost of a no-show, and it happens more predictably than most hotels realize.
Cancellations and no-shows aren’t random. They follow patterns you can forecast — by segment, by channel, by how far out the booking was made. Forecast them well, and you can safely sell that room twice, tune your cancellation policy, and stop leaving revenue on empty beds.
A no-show cost us a room we’d turned three other guests away for on a sold-out night. That’s the real price — and we’re too scared to overbook, so we just eat it.
Quick scope note: this post is about forecasting cancellations and no-shows — measuring and predicting the risk. What you DO about it, the overbooking strategy itself, lives in the overbooking guide. Read this to build the forecast; read that to act on it.
Key takeaways
- Cancellation rate = cancelled bookings ÷ total bookings.
- A no-show never arrives and never cancels; it’s distinct from a cancellation.
- Both are forecastable — stable by segment, channel, and lead time.
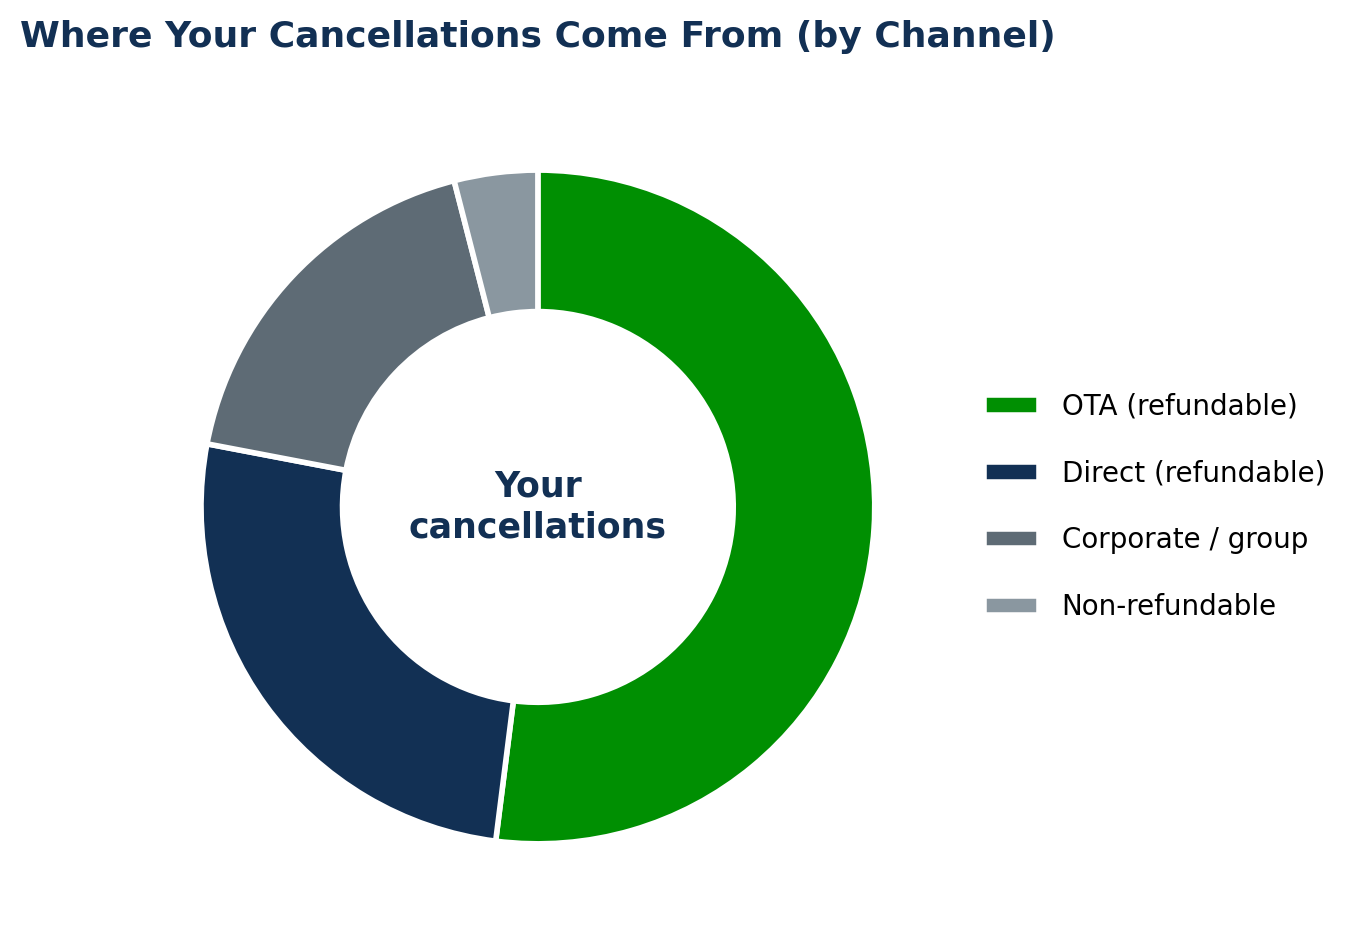
- OTA and refundable rates cancel far more than direct or non-refundable.
- The point of forecasting is to safely resell rooms and protect revenue.
What is hotel cancellation rate?
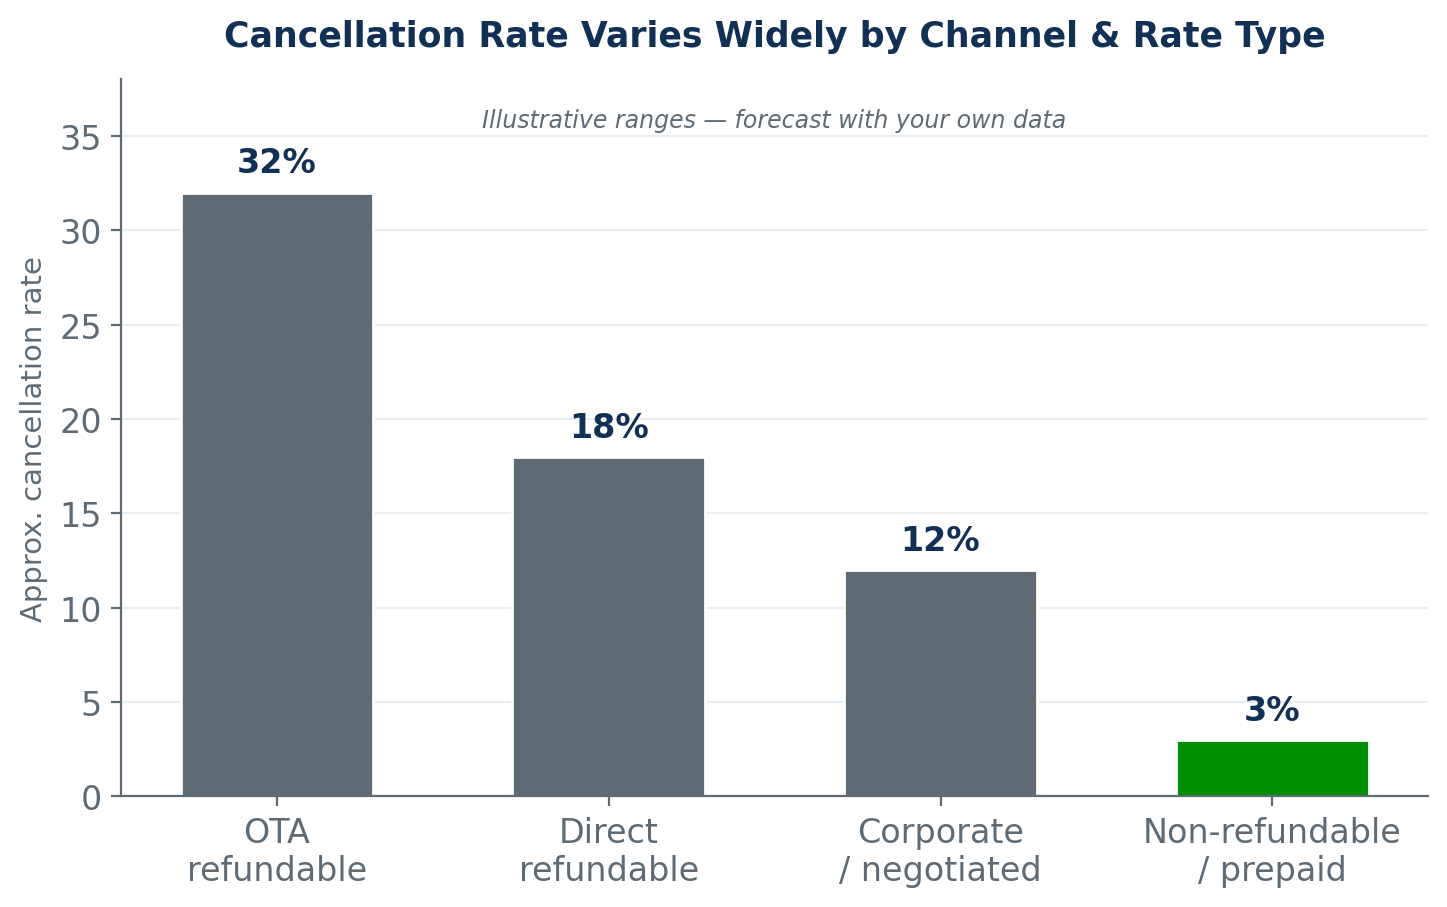
A blended, hotel-wide cancellation rate is a starting point, but it hides more than it shows. The useful version is broken out — because a 32% OTA-refundable rate and a 3% non-refundable rate averaged together tell you nothing you can act on.
Cancellation vs no-show: what’s the difference?
| Cancellation | No-show | |
|---|---|---|
| Guest gives notice | Yes | No |
| When it happens | Days before arrival | On the arrival date |
| Chance to resell | Often | Almost none |
| How to manage | Policy + overbook | Overbook to the forecast |
Why forecasting cancellations and no-shows matters
Every cancellation and no-show is a room you could have sold. Without a forecast, you have two bad options: leave rooms unsold to be “safe,” or resell blindly and risk walking a guest. A good forecast gives you the third option — sell to real, expected demand and protect occupancy without the day-of scramble.
How to calculate your cancellation and no-show rates
The math is simple; the value is in the breakdown. Calculate the base rate, then split it by the dimensions that actually drive it.
- Cancellation rate = cancelled bookings ÷ total bookings for the period.
- No-show rate = no-show bookings ÷ arrived-or-expected bookings for the period.
- Break each out by segment, channel, and rate type — the blended number is the least useful one.
- Add lead time: group cancellations by how far before arrival they happened.
A worked example: 1,000 bookings in a month, 180 cancelled and 40 no-shows. Cancellation rate is 18%, no-show rate is 4%. But split it and the picture sharpens — the OTA-refundable segment might run 32% while non-refundable runs 3%. That spread is where forecasting lives.
What drives cancellations and no-shows
Four factors explain most of the variation. Forecast on these, not on a single average.
- Channel — OTA bookings cancel far more than direct, partly because they’re easy to book on impulse and easy to cancel.
- Rate type — refundable rates cancel; non-refundable and prepaid rates almost never do.
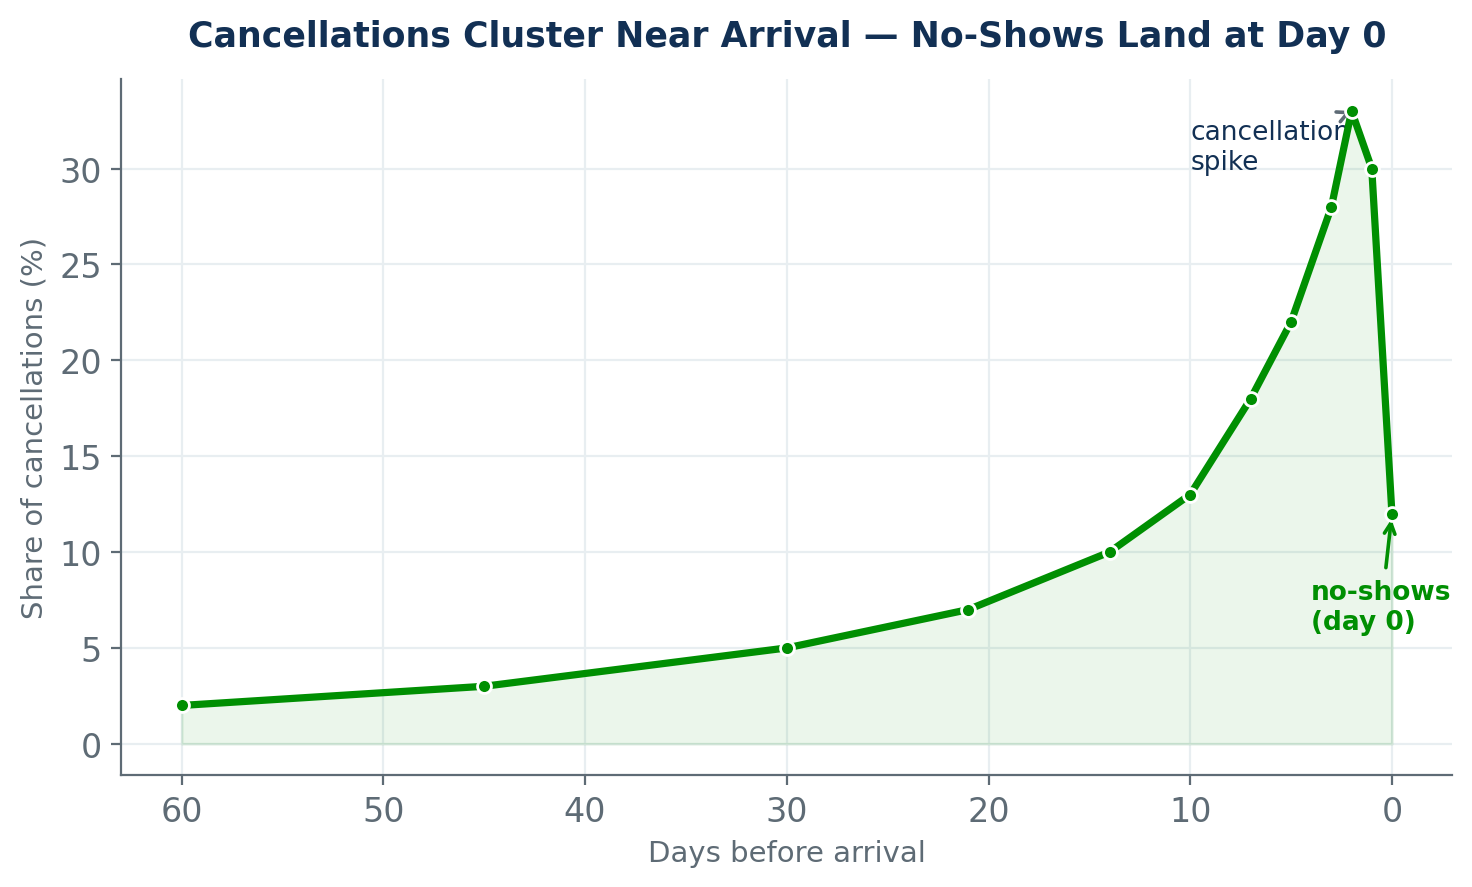
- Lead time — the further out a booking, the more time it has to cancel; the risk climbs toward arrival.
- Segment and season — leisure, corporate, and group behave differently, and peak periods shift the pattern.
How to forecast them
Forecasting cancellations and no-shows is pattern-matching, not fortune-telling. The behavior is stable enough that last year’s pattern is a strong guide to this year’s — if you look at it the right way.
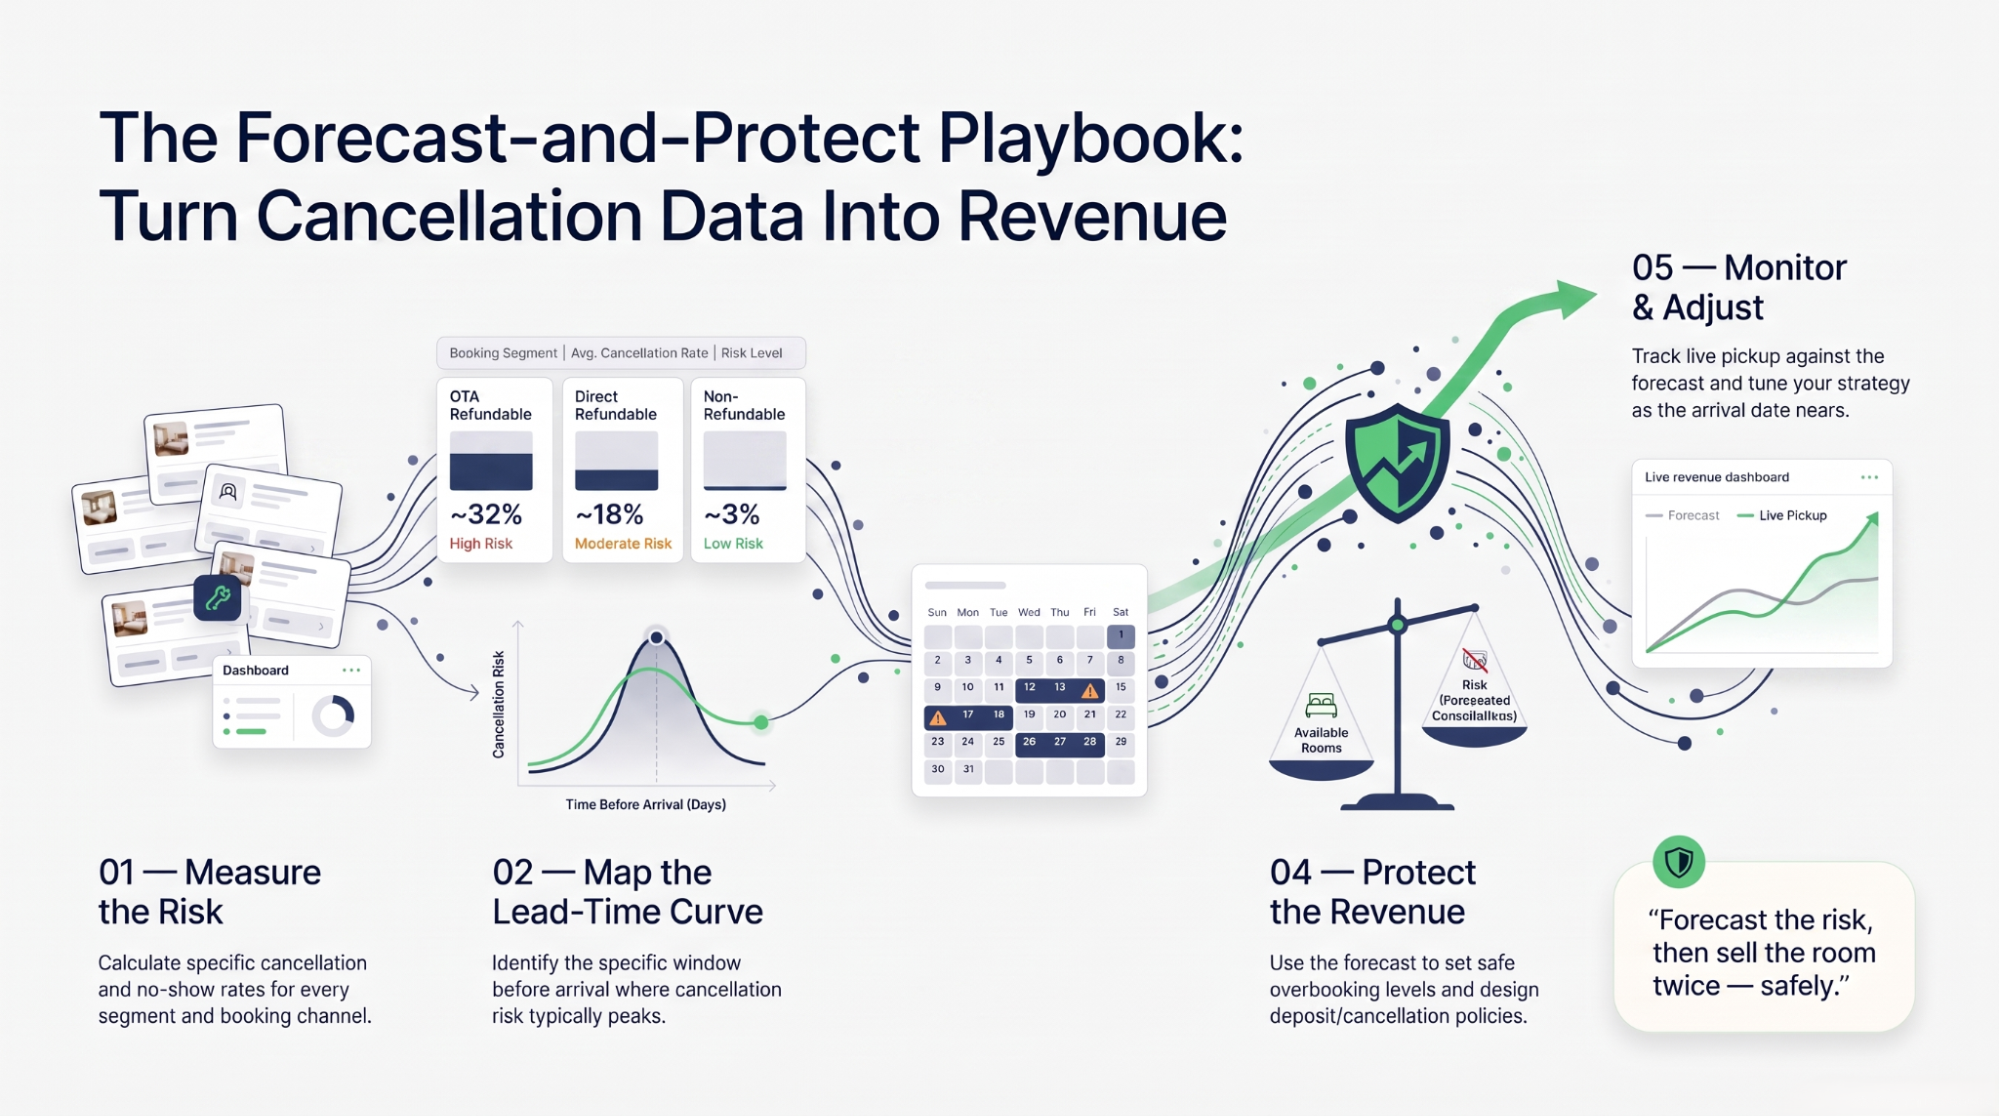
Start with your historical rates by segment and channel. Then build a lead-time curve: for each days-before-arrival bucket, what share of those bookings historically cancelled? Apply those rates to your current on-the-books reservations, and you get a projection of how many rooms will actually free up on a given date — not a guess, a number.
How forecasting protects revenue
A forecast is only worth building if it changes a decision. Cancellation and no-show forecasts protect revenue in three concrete ways.
- Overbooking to the forecast: if you reliably expect eight cancellations on a sold-out night, selling a few extra rooms fills the beds those cancellations would have emptied — without walking anyone, because the number is grounded in history.
- Policy design: if a channel or segment cancels heavily, a non-refundable rate or a deposit requirement fences that risk — you trade a little booking volume for a lot more certainty.
- Displacement decisions: knowing your real expected arrivals sharpens every call about whether to take a group, hold inventory, or open a discount.
Where cancellation forecasting goes wrong
1 · One blended rate
A single hotel-wide cancellation number averages away the pattern. If you can’t see it by channel and rate type, you can’t forecast it — you’re just guessing with extra steps.
2 · Ignoring lead time
Cancellation risk isn’t flat across the booking window; it climbs toward arrival. A forecast that ignores when cancellations happen will overbook too early and scramble too late.
3 · Over-overbooking
Overbook past the forecast and you start walking guests — and the walk cost, in money and reputation, dwarfs an empty room. Overbook to the forecast, not beyond it.
4 · Setting it and forgetting it
Patterns shift with season, events, and channel mix. A forecast built once and never revisited slowly drifts from reality.
Case study: forecasting that pays off
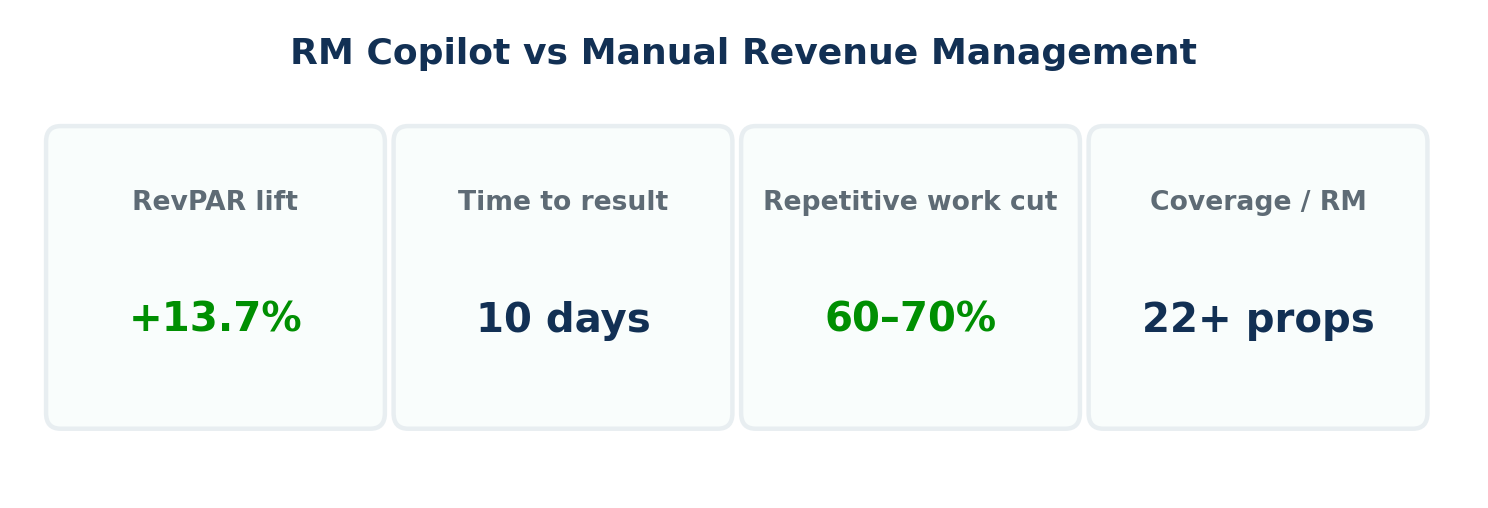
Set against manual revenue management, RM Copilot delivered a 13.7% RevPAR lift in 10 days across 47 properties while removing 60–70% of repetitive work. Forecasting cancellations and no-shows accurately — by segment, by lead time, across a portfolio — is exactly the kind of pattern analysis that’s tedious by hand and powerful when it’s done consistently and turned into overbooking and policy recommendations a team can apply.
How RevEvolve helps you forecast and protect
RM Copilot is an operator-facing AI revenue copilot. It analyzes your historical cancellation and no-show patterns — by segment, channel, and lead time — and applies them to your on-the-books reservations to project how rooms will actually free up. It simulates the impact of an overbooking level or a policy change before you commit, and recommends the move with the reasoning attached. Then your team reviews and applies it. It does not auto-set overbooking, auto-write cancellation policies, or push changes to your systems. You can see the forecasting capability across the workflow.
Cancellation forecasting: three objections
Turn a predictable loss into protected revenue
Cancellations and no-shows feel like bad luck, but they’re among the most forecastable things in your business. The behavior is stable by segment, by channel, and by lead time — which means the empty room a no-show leaves behind was, in aggregate, entirely predictable.
Measure your rates properly, build the lead-time curve, apply it to your on-the-books, and use the forecast to overbook and set policy with confidence. Done well, it lets you sell the room twice without ever having to gamble.
Keep going: Hotel overbooking strategy · Hotel occupancy rate · Minimum length of stay · BAR & rate fences.