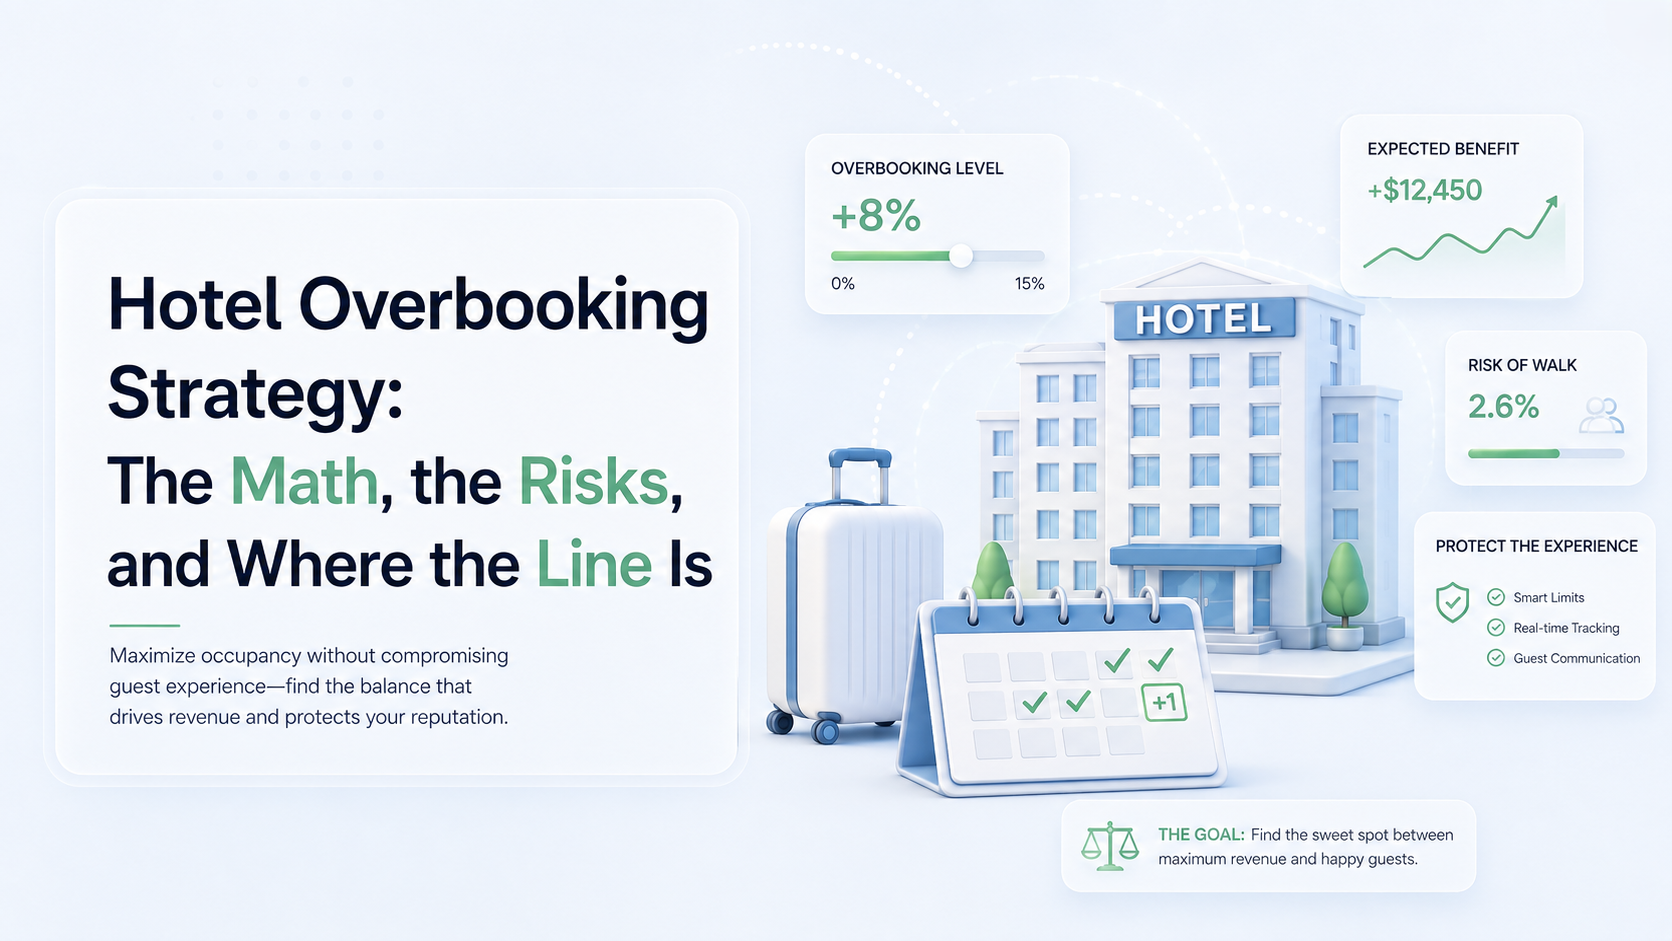
QUICK ANSWER — Hotel overbooking is accepting more reservations than you have rooms, on the expectation that some guests will cancel or fail to arrive. The correct sizing method is the overbooking ratio: cost of walking ÷ (cost of walking + cost of an empty room). That ratio is a confidence threshold, not a number of rooms — it tells you how certain you should be of not walking anyone. Typical no-show rates run 5–15%, but a blended rate hides most of the risk.
It is 9:40 p.m. and the last two arrivals are standing at the desk with confirmed reservations you cannot honour. Somebody is about to be driven to a property across town. The revenue that decision earned you across the previous eleven nights was real. Whether it was worth this depends entirely on a number most properties have never actually calculated.
Overbooking is one lever inside inventory control — the broader discipline is here. This guide is the overbooking math itself: how to size the risk properly, why the common formula is wrong, what walking a guest really costs, and the dates where the answer should simply be no.
We overbook by 8 because we’ve always overbooked by 8. Nobody can tell me where the 8 came from. I inherited it.
Key takeaways
- “10% no-shows, so overbook by 10” is wrong. You do not walk on an average night — you walk in the right-hand tail of the arrivals distribution.
- The overbooking ratio is walk cost ÷ (walk cost + empty room cost). It sets a confidence level, not a room count.
- A higher walk cost means overbooking LESS, not more — the counterintuitive result most guides get backwards.
- Walk cost is routinely underestimated. Research finds roughly 70% of walked guests never return, and that never appears on the folio.
- Some dates should not be overbooked at all, regardless of what the model says.
What Is Hotel Overbooking?
The logic follows from perishability. An unsold room night is worth nothing the moment the night passes; there is no inventory to carry forward. If a hotel sells exactly its room count and eight guests do not arrive, those eight nights are gone permanently, and the revenue with them.
It is worth separating two things that get conflated. Intentional overbooking is a deliberate, modelled revenue decision. Accidental overbooking is an operational failure — a channel sync problem, a manual error, an inventory discrepancy — and it carries all of the guest cost with none of the revenue benefit. This guide is about the first. If you are experiencing the second, the fix is in your connectivity, not your strategy.
Legally, the practice is generally permitted provided the guest is re-accommodated appropriately, though specific consumer-protection obligations vary by jurisdiction and by what your own booking terms promise. Check your local position rather than assuming.
The Math Most Guides Get Wrong
Open almost any overbooking article and you will find a version of this: no-shows run 10%, walking costs $300, so the expected cost of an extra booking is $30 against an ADR of $200, and the arithmetic clearly favours overbooking.
That calculation is wrong, and the error is not small. It multiplies the walk cost by the average no-show rate, as though every overbooked room carried a 10% chance of a walk. It does not. You only walk when arrivals exceed capacity — and whether that happens depends on the shape of the distribution, not its midpoint.
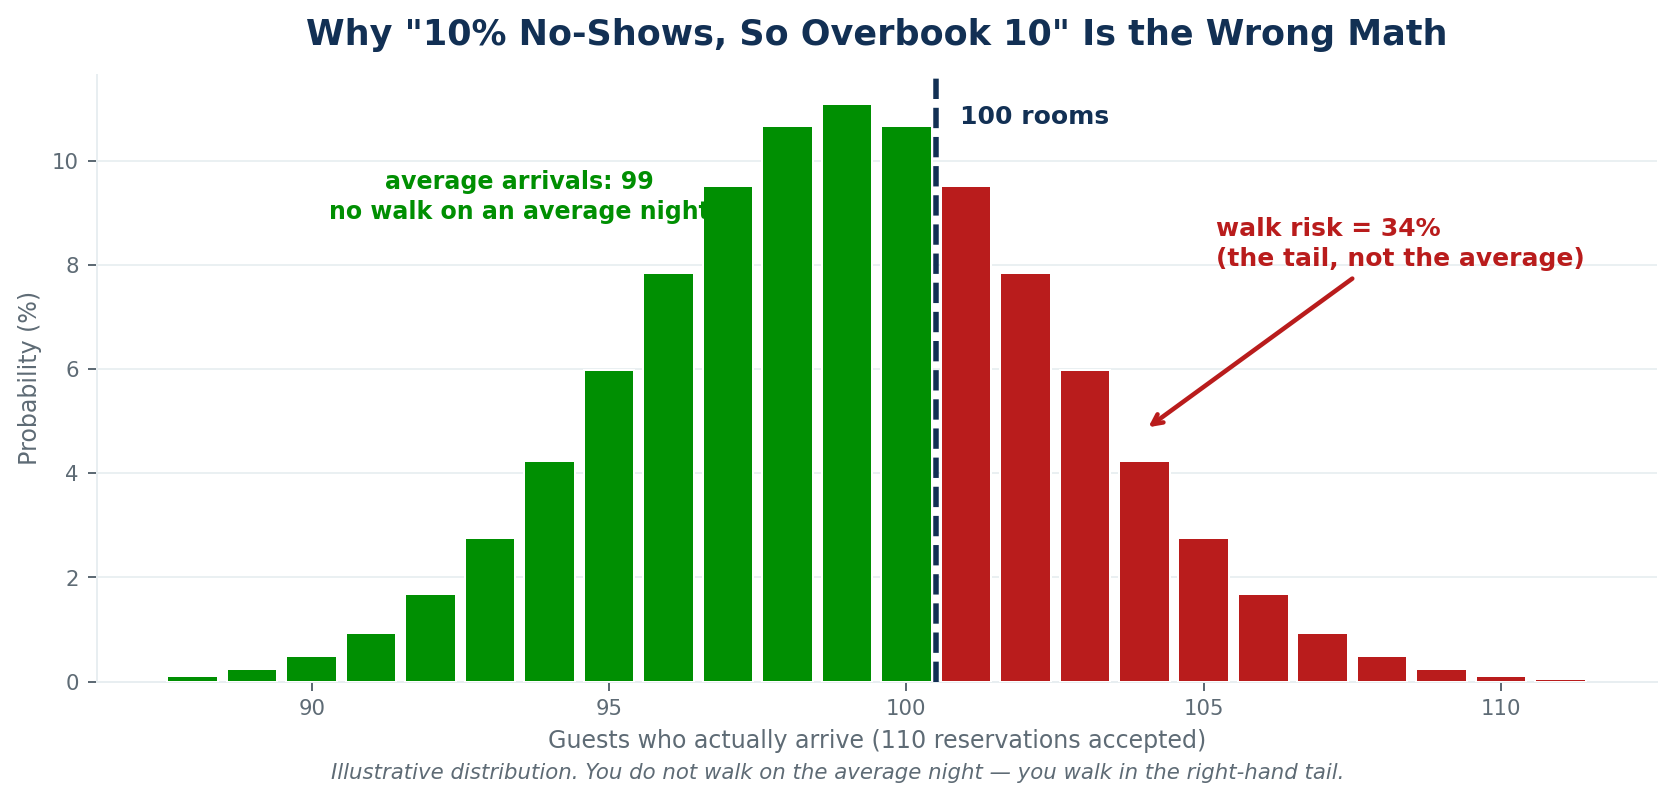
Take a 100-room hotel accepting 110 reservations with a mean no-show rate of 10%. On an average night, 99 guests arrive and nobody is walked. That is what the naive model sees. But no-show rates vary night to night, and in the illustration above roughly a third of nights land above 100 arrivals. The walk risk is that tail — several times larger than the naive figure suggests.
The practical consequence is that properties using average-based math systematically overbook too aggressively and are then surprised by how often they walk. The number of no-shows you expect matters far less than how reliably you can predict it.
The Overbooking Ratio: The Method That Holds Up
The established approach is a critical-fractile calculation — the same logic used for perishable inventory in other industries, and the version taught in hospitality revenue management. It asks a better question: not “how many rooms should I oversell?” but “how confident do I need to be that I will not walk anyone?”
How to use it
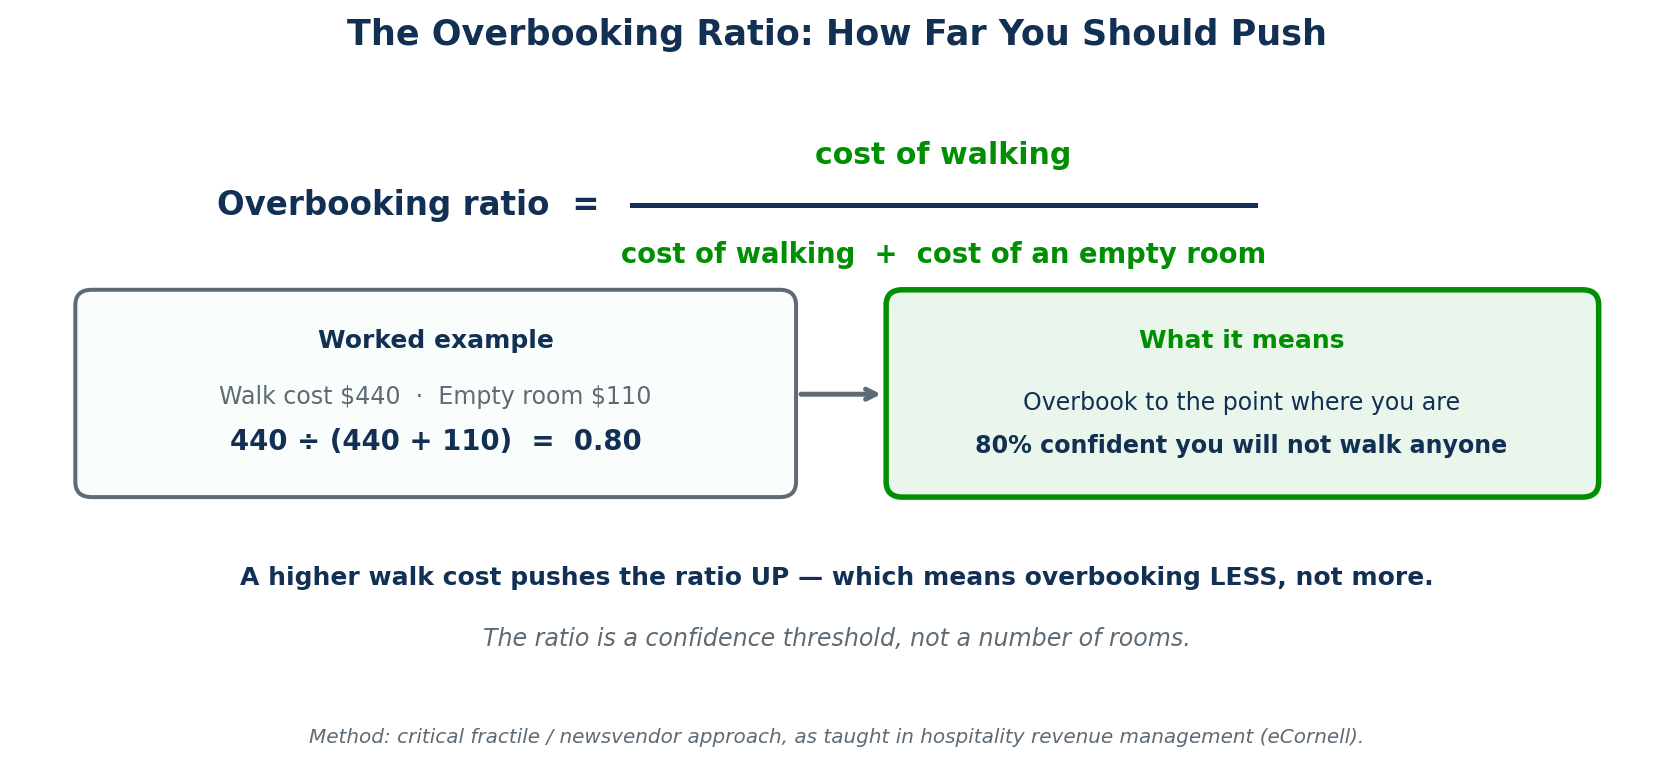
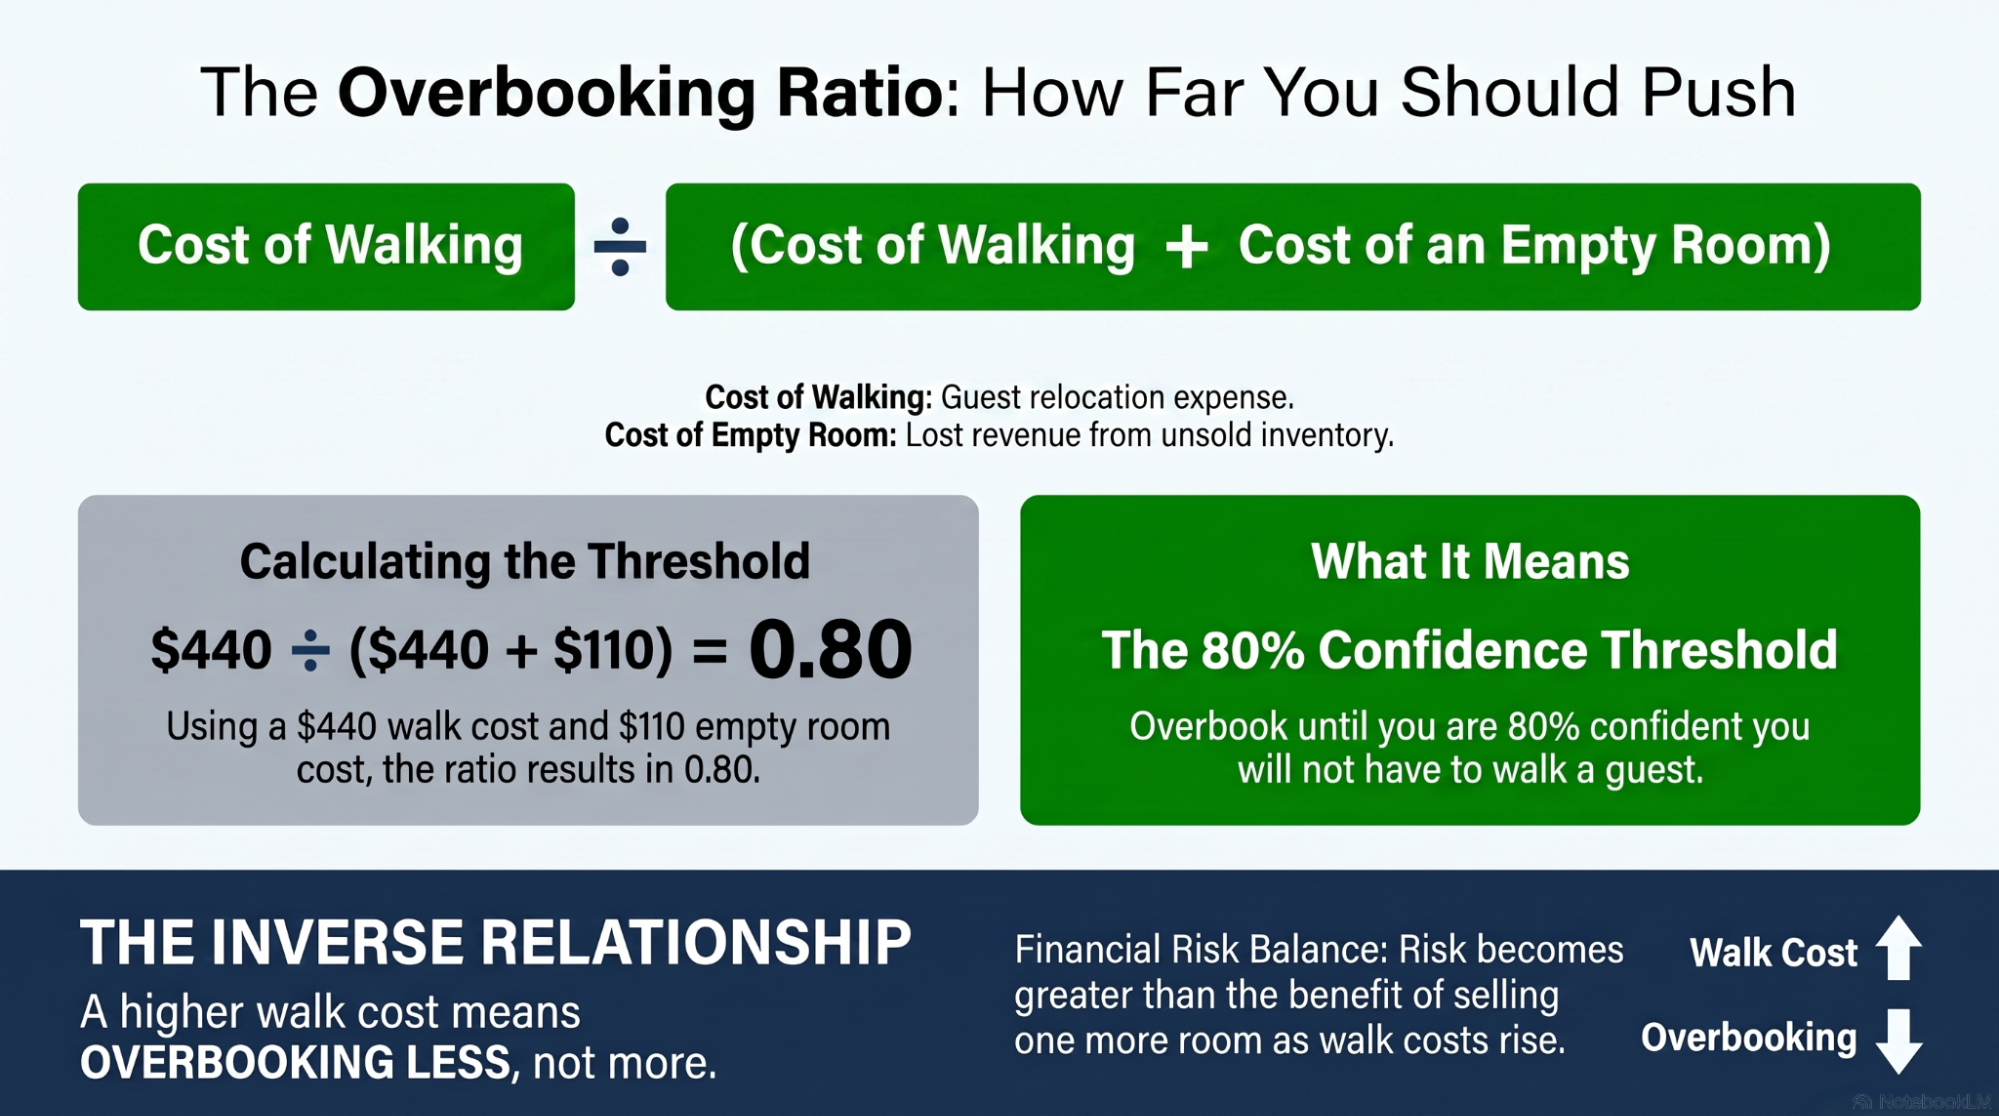
Divide the cost of walking a guest by the sum of the walk cost and the cost of leaving a room empty. With a $440 walk cost and a $110 empty-room cost, the ratio is 0.80. That figure is a confidence threshold: overbook up to the point where you are 80% confident you will not have to walk anybody, based on your own no-show distribution.
The result that surprises people is the direction. A higher walk cost raises the ratio, which means overbooking less aggressively, not more. Properties in markets where re-accommodation is expensive or scarce — a sold-out city, a remote resort, a single-hotel town — should be more conservative precisely because the downside is worse. The naive expected-value approach pushes in the opposite direction.
| Input | What it means | Where to get it |
|---|---|---|
| Cost of walking | All-in cost of re-accommodating one guest, including goodwill | Your own walk log — see the next section |
| Cost of an empty room | Contribution lost on an unsold room: rate minus variable cost | ADR less CPOR for the date |
| No-show distribution | Not just the average — the spread, by segment and day of week | 24–36 months of PMS history |
| Output | A confidence threshold, applied against your distribution | Recalculated per date, not set annually |
What Walking a Guest Actually Costs
Every overbooking model depends on the walk cost, and most properties guess at it. The guess is almost always low, because the visible costs are the small ones.
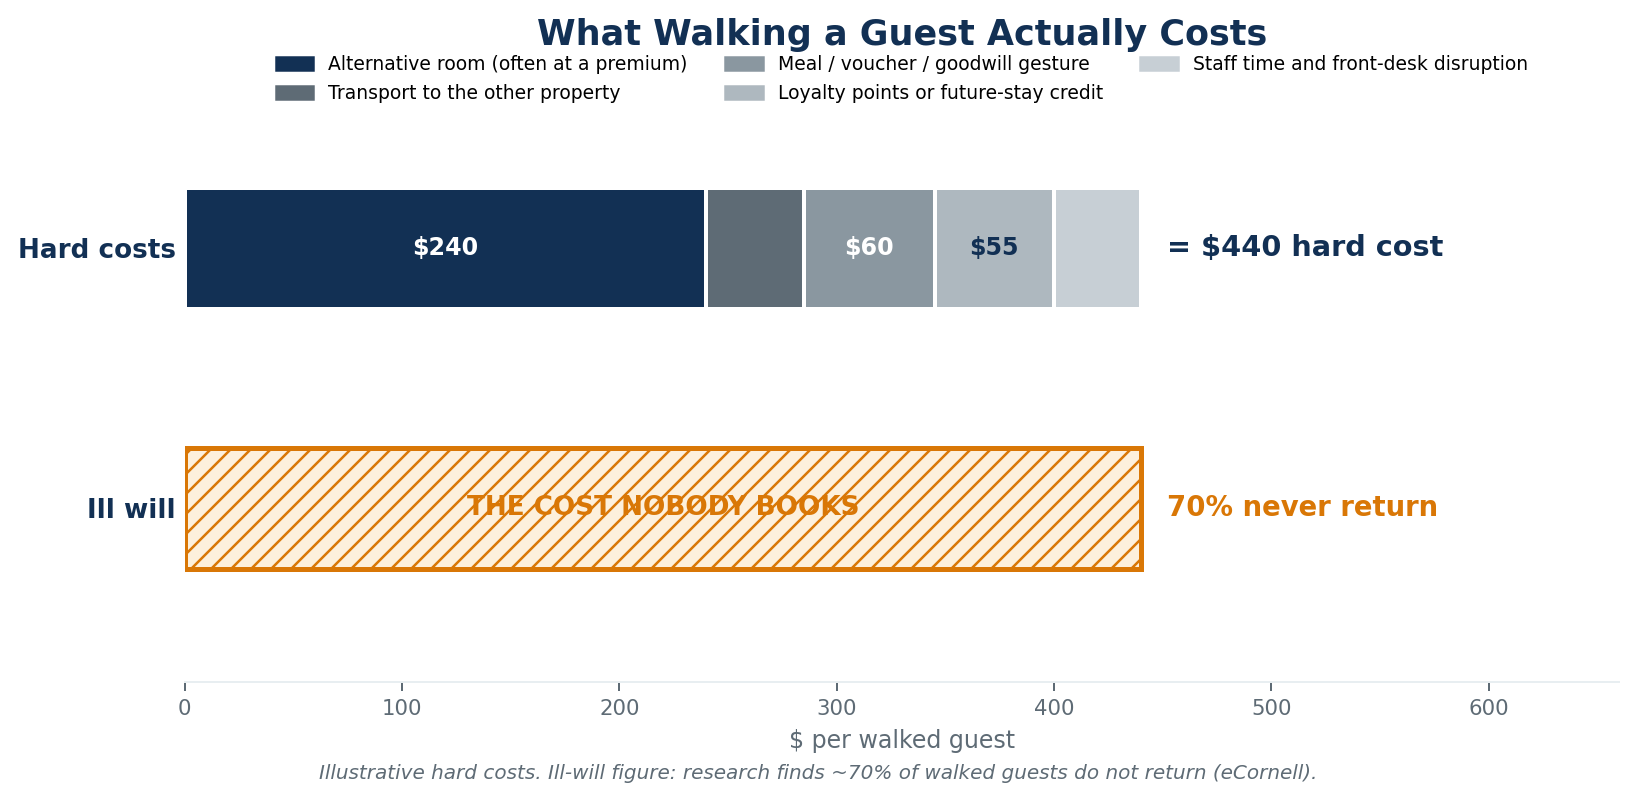
The hard costs are straightforward to total: the alternative room, frequently at a higher rate because you are buying on the night in a market that is already tight; transport; a meal or voucher; loyalty points or a future-stay credit; and staff time absorbed at the busiest point of the evening. In the illustration those come to $440, and that figure is conservative for a compression night in an expensive market.
The cost that never reaches the folio is the one that matters most. Research cited in hospitality education finds that roughly 70% of walked guests do not return. If a repeat guest’s lifetime value to you is several thousand dollars, losing seven of them for every ten walks dwarfs the hard costs entirely — and the loss is invisible because it shows up as an absence, never as a line item.
Build a walk log
Most properties cannot answer “what does a walk cost us?” because nobody records it. Log every walk with the date, the segment, the guest’s status, the alternative property, every cost incurred, and whether that guest ever booked again. Six months of that turns your overbooking model from an assumption into a calculation.
Why a Blended No-Show Rate Hides the Risk
A single property-wide no-show figure is the second common modelling error. No-show behaviour varies enormously by segment, rate plan, and channel — and a blended average conceals exactly the variation the model depends on.
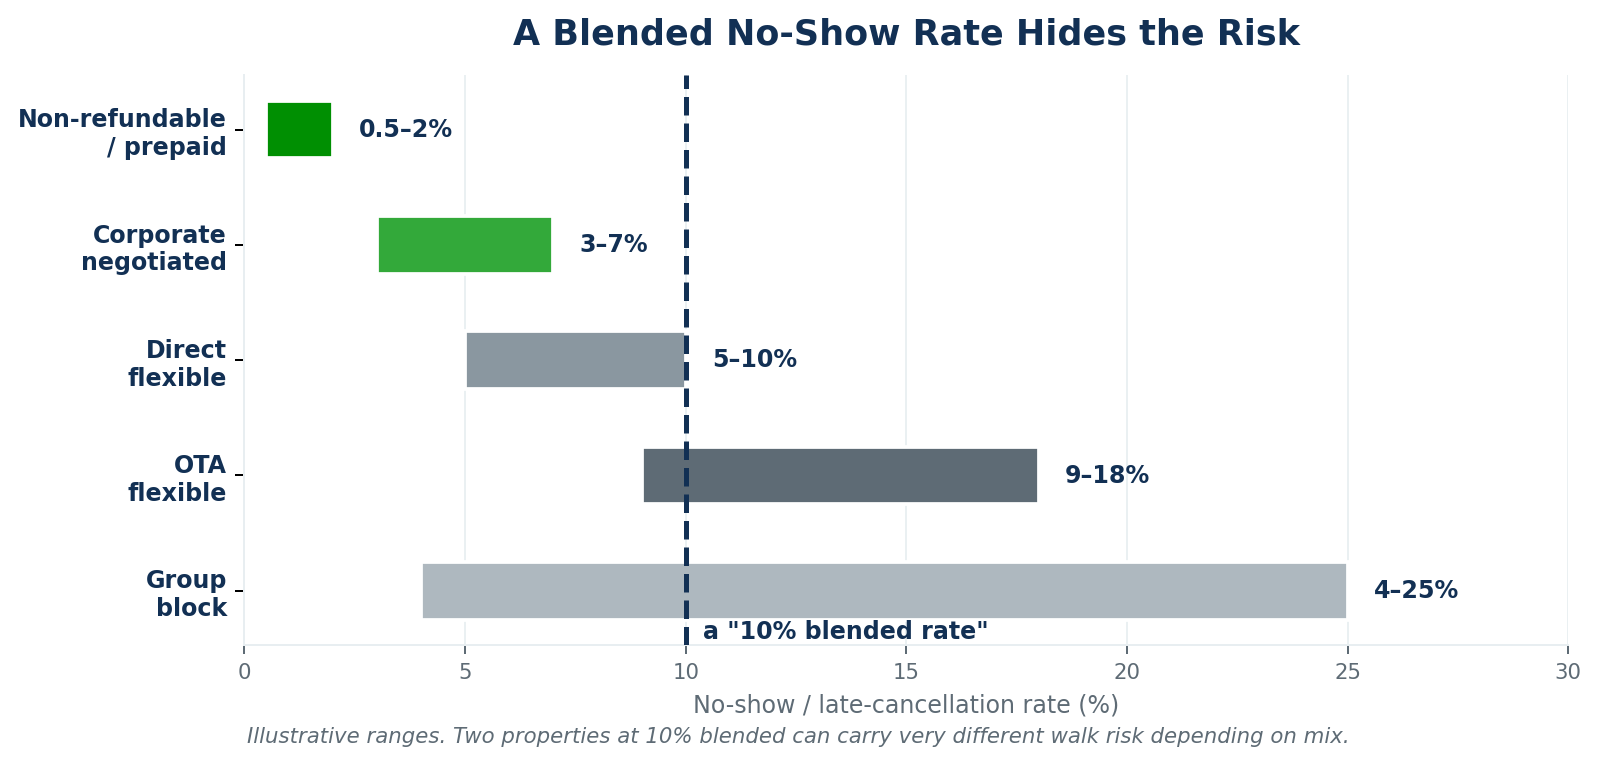
A prepaid, non-refundable booking almost always arrives. A flexible OTA reservation with free cancellation is a much softer commitment. Group blocks carry their own pattern, often with a large late release rather than individual no-shows. Two properties reporting the same 10% blended rate can carry entirely different risk profiles depending on how their business is composed on a given night.
The fix is to model no-shows by segment and apply the mix for the specific date, rather than one annual figure applied to every night of the year. Day of week matters too: a Tuesday corporate-heavy night and a Saturday leisure night behave differently, and averaging them together loses the signal in both.
Where the Line Is: Dates You Should Not Overbook
The model returns a number for every date. Judgment should override it on some of them, and this is the section most revenue management content omits.
When re-accommodation is unavailable
The entire practice rests on being able to place the guest somewhere acceptable. On a citywide sellout, during a major event, or in a market where the nearest comparable property is an hour away, that assumption fails. The model does not know your market is full; you do.
Late-arrival and single-property markets
A guest arriving at 11 p.m. cannot reasonably be sent across a city. If your arrival pattern skews late, your effective walk cost is higher than the daytime figure suggests, and the ratio should reflect it.
Guests you cannot afford to walk
Top-tier loyalty members, contracted corporate accounts, wedding parties, guests with accessibility requirements, and anyone travelling with young children. Some of these carry contractual exposure; all of them carry disproportionate relationship cost. Protect them in inventory rather than discovering the problem at the desk.
When your forecast confidence is low
New properties, post-renovation reopenings, unusual event patterns, and markets in flux all mean your no-show distribution is unreliable. Overbooking is a bet on your own predictability; when that is weak, the correct exposure is small or zero.
If You Do Have to Walk Someone
The decision has already been made by the time this matters, and how it is handled determines whether you lose a night’s goodwill or a customer.
- Decide early, not at 10 p.m. If the arithmetic is clear by mid-afternoon, you have options and time.
- Choose deliberately. Shortest stay, lowest-rated segment, non-loyalty, earliest arrival window — never simply whoever appears last.
- Over-compensate rather than negotiate. A comparable-or-better room, transport, the first night covered, and a credit toward a return stay costs less than the review.
- Call ahead and confirm the alternative before the guest leaves your lobby. Sending someone to a property that then turns them away is the version people write about.
- Own it without excuses. Explaining that a system oversold is worse than apologising plainly and fixing it.
- Log it, and follow up afterwards. Both for the guest relationship and for the walk-cost model.
Simulate Before You Commit
Overbooking is the clearest case in revenue management for testing a decision before making it, because the downside is asymmetric. An unsold room costs you one night’s contribution. A walked guest costs you the hard expense plus, most of the time, the guest.
That is the question the What-If Simulator exists to answer: what happens to projected occupancy, revenue, and exposure if you accept ten more reservations on this date rather than five? Seeing both sides of that trade before committing turns an inherited habit into a decision with a stated confidence level.
More broadly, RM Copilot analyzes demand, pace, and segment mix across your own PMS data and recommends the action with the reasoning attached — your team reviews the recommendation and applies it. For overbooking specifically, the value is in modelling the no-show distribution per date and segment rather than applying one annual figure to every night, which is what makes the confidence threshold meaningful rather than theoretical.
Worth separating two categories people conflate: some hospitality AI is guest-facing — chat and messaging that help you talk to travelers. RM Copilot is operator-facing, working with your revenue team on the pricing decision itself.
Questions From the Revenue Meeting
Keep going: Hotel inventory control strategies · What-If Simulator · What RM Copilot does.