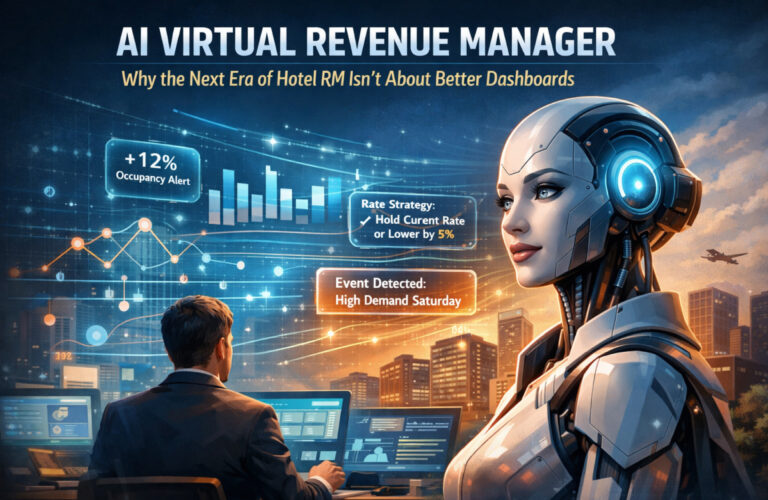
AI Virtual Revenue Manager: Why the Next Era of Hotel RM Isn’t About Better Dashboards
The next evolution in hotel revenue management isn’t a faster dashboard or a smarter pricing algorithm – it’s an AI…
Discover tailored revenue strategies that help
maximize occupancy, optimize pricing, and
boost profitability.
Get tips, insights, and expert advice to maximize performance.
Explore strategies, successes, and insights from real-world examples.
Get clear, step-by-step guidance to maximize the platform’s features and benefits.
Access comprehensive whitepapers packed with data-driven insights, expert analysis, and proven strategies to help you drive smarter decisions and sustainable revenue growth.
Explore expert insights, tips, and the latest trends in revenue management to boost your financial strategies and drive growth.
Market Insights | Harikrishna Patel February 16, 2026
During FIFA World Cups, hotel booking windows compress dramatically — from a typical 60–90 day lead time down to 14–21 days for group stage matches, 5–10 days for quarterfinals, and as few as 3–5 days for semifinals and the final. This pattern has repeated across Russia 2018, Qatar 2022, and is already emerging in early 2026 booking data. Hotels that rely on standard pace reports built around normal seasonal patterns will misread demand timing, underprice late surges, and leave significant RevPAR on the table.
Here’s a scenario most revenue managers will face this summer: it’s April 2026, you’re staring at your pace report for a World Cup group stage week in mid-June, and on-the-books occupancy is sitting at 11%. Your STLY comparison shows 35% at this same point last year for the same dates. Every instinct screams “drop rates.”
That instinct is wrong.
The problem isn’t weak demand — it’s that World Cup booking behavior follows an entirely different calendar than normal hotel demand. Fans don’t book when hotels expect them to. They book when ticket allocations are confirmed, when their team qualifies for the next round, and when travel logistics crystallize — often just days before arrival.
This blog breaks down exactly when World Cup demand materializes, what past tournaments tell us about booking window compression by tournament stage, what the 2026 data is already showing, and how to adjust your pricing strategy so you’re not caught flat when the real surge arrives.
Booking window refers to the number of days between when a guest makes a reservation and when they arrive. In a typical U.S. hotel market, the average booking window ranges from 21 to 45 days for leisure travelers and 7 to 14 days for corporate guests. Revenue managers build their entire pricing cadence around these patterns — setting rates 90 days out, adjusting at 30 days, and fine-tuning in the final week.
World Cup demand shatters this cadence. Three structural factors explain why:
Unlike a concert or conference where attendees know their plans months ahead, World Cup fans wait for ticket confirmation before booking hotels. FIFA’s ticketing process for 2026 has unfolded in phases — a major ticket draw ran from October 27–31, 2025, followed by the match schedule release on December 5, 2025. Each of these milestones triggered immediate booking surges. According to SiteMinder data from December 2025, booking volumes for the week of the World Cup Final at MetLife Stadium climbed 102% year over year within days of the schedule announcement, with ADR up 72% for the same period.
Once the tournament begins, nobody knows which teams will advance past the group stage. A fan who bought a group stage ticket for Argentina vs. Algeria in Kansas City on June 16 has no idea whether Argentina will play a Round of 32 match in New York on June 30 or a quarterfinal in Boston on July 9 until those results are decided on the pitch. This creates a cascading wave of last-minute bookings for knockout round matches — bookings that physically cannot be made until 48–72 hours after the previous round concludes.
The 2026 World Cup is spread across 16 cities in three countries. Fans following a team may visit three or four cities over the tournament. They book city by city as the path becomes clear, not as a single itinerary months in advance. This fragments demand across markets and compresses booking windows for each individual city into shorter bursts.

The pattern of late-arriving demand isn’t speculation. It’s documented across multiple tournaments. Here’s what the data shows:
Moscow saw ADR peak at $444 during the 32-day tournament window, compared to just $116 for the same period the following year — a gap of nearly 4x, according to STR data. What’s less discussed is the timing. Hotels that held inventory and priced aggressively in the final 14 days captured the bulk of that premium. Properties that dropped rates 60 days out, panicked by low OTB numbers, filled rooms at rates far below what the market ultimately supported.
Russian host cities also showed pronounced game-day compression with steep ADR uplifts, but some typical summer visitors deferred or chose non-host destinations, which softened full-month averages. The lesson: match-day demand was explosive but concentrated, and the hotels that won were the ones that understood the timing of arrival.
Qatar’s hotel market initially set prices at extraordinary levels — Doha hotels peaked at an average of $1,312 per night during the opening week, more than 10x the normal rate. But a critical dynamic emerged: occupancy on the books averaged 85% during the event period, with peaks reaching 90.5% on days when the host nation and the U.S. both played.
The more instructive finding was what happened before kickoff. Doha hotel prices dropped 34% between mid-October and early November 2022 — a massive correction that caught many hoteliers off guard. Why? Because occupancy was stagnating at premium price points and hotels needed to adjust to match actual demand timing. Fans booked late, and properties that held extreme rates too long missed the window to capture volume.
The Qatar experience also confirmed that fans wait for their team’s advancement before committing to later-stage matches. STR noted that occupancy on the books was expected to rise further for later event dates as fans waited for pool play results before committing to travel.
Based on historical patterns from Russia 2018, Qatar 2022, and early 2026 signals, here is the booking window compression framework every revenue manager should internalize before summer:
| Tournament Stage | Typical Booking Window | What Happens & Why | Projected ADR Uplift |
|---|---|---|---|
|
Group Stage (Jun 11–28) |
14–30 days | Predictable surge after ticket/schedule confirmation. Fans know their team’s group matches months ahead. BUT many still wait until 2–4 weeks out to finalize travel. As of Feb 2026, most U.S. host cities show single-digit OTB occupancy for group dates. | +40–120% |
|
Round of 32 (Jun 28–Jul 3) |
7–14 days | First knockout round. Fans react to group results. Booking surge starts 48–72 hours after group stage concludes. Cities hosting R32 matches see sharp pickup in the final 10 days. | +65–100% |
|
Round of 16 (Jul 4–7) |
5–10 days | High uncertainty. Fans may not know which city their team plays in until 3–5 days before the match. Lead time compression accelerates. Jul 4 in Philadelphia adds Independence Day demand on top of World Cup. | +80–130% |
|
Quarterfinals (Jul 9–12) |
5–7 days | Booking windows collapse to under a week. Kansas City, Los Angeles, Boston, Dallas, and Miami host QF matches. KC’s limited supply amplifies pricing power. Hotels should hold premium inventory. | +100–170% |
|
Semifinals (Jul 14–15) |
3–5 days | Dallas and Atlanta host. Extreme late compression. Price sensitivity approaches zero for remaining fans. Booking window shrinks to 3–5 days in past tournaments. Do not discount. | +150–200% |
|
Final (Jul 19) |
3–7 days | MetLife Stadium, NY/NJ. Projected to produce the highest single-night ADR in U.S. hotel history for many brands. Final booking window often compresses to 3 days for actual attendees, though speculators may book earlier. | +150–250%+ |
Key Takeaway : The further into the tournament you go, the shorter the booking window and the higher the ADR potential. Revenue managers who treat knockout round dates like normal business will underprice the most profitable nights of the summer.
If you’re looking at your OTB for June and July 2026 right now and feeling nervous, you’re not alone. But the data is consistent with what we’d expect at this stage in the cycle.
As of late 2025 and early 2026, on-the-books occupancy for tournament dates in most U.S. host cities remains in single digits. Lighthouse (formerly OTA Insight) data across seven measurable U.S. markets — Atlanta, Boston, Dallas, Los Angeles, New York, San Francisco, and Seattle — showed OTB levels still well below typical seasonal benchmarks. This mirrors the pre-tournament pattern from every recent World Cup.
The December 5, 2025 schedule release triggered immediate booking acceleration. Key Data reported that host cities posted an average 29% increase in net reservations per property in the week of December 1–7, 2025 compared to the same week in 2024, with 13 of 16 host markets showing positive year-over-year growth. Average daily rates jumped 25% across all markets.
Kansas City emerged as the breakout market during schedule release week, while Philadelphia and Boston posted reservation increases of approximately 80% and 78% respectively. SiteMinder data confirmed that bookings for the Final week at MetLife Stadium climbed over 100% year over year with ADR up over 70%.
Amadeus Demand360 data from January 2026 shows that Canadian and Mexican host cities are pacing well ahead of U.S. markets. Vancouver hotel occupancy for tournament dates reached 53% (up from 31% STLY). Toronto jumped from 15% to 29%. Mexico City rose from 4% to 21%. Guadalajara moved from 3% to 24%. Monterrey from 3% to 37%.
Meanwhile, rate growth in Mexico has outpaced the U.S. significantly — Mexico saw +114% YoY rate growth and Canada +92%, compared to +55% for U.S. host cities. Guadalajara’s advertised room prices surged 385% between lead time 350 days and 147 days for group stage dates. Monterrey saw 204% growth in the same window.
Several factors explain the slower U.S. booking pace and why it’s not a cause for alarm:
The Signal : Across all 16 host venues, hotel occupancy for group stage dates has already increased from 16% to 29% as of January 2026, according to Amadeus data. The trajectory is upward — and it will accelerate sharply once the next major ticket release phases complete.
Understanding that booking windows will compress is only half the battle. Executing the right pricing response is where revenue is won or lost. Here are the five most common mistakes we’ve seen across past mega events:
Your STLY comparison is useless for World Cup dates. Normal seasonal demand doesn’t apply. A date showing 8% OTB at 60 days out will likely finish above 80% occupancy for most host city match nights. Dropping your rate at this stage gives away your best rooms at discount prices to early bookers who would have paid more later.
Not all World Cup nights are equal. A June 22 Argentina vs. Austria match in Dallas (projected +90–130% ADR uplift) is radically different from a June 22 Norway vs. Senegal match in New York (projected +20–35%). Each match night needs its own rate strategy based on matchup, fan base travel behavior, and city-specific supply dynamics.
Fans arrive 1–2 days before a match and often stay 1 day after. Shoulder nights (the day before and after a match) typically achieve 60–80% of the match-night ADR premium. Hotels that only spike rates for the match night itself miss this adjacent revenue.
If you sell out at 90% capacity three weeks before a quarterfinal, you’ve left the most price-insensitive demand on the table. Fans booking 3–5 days before a semifinal have near-zero price sensitivity — they need a room and will pay almost any rate. Hold 10–15% of premium inventory for the final booking window.
Standard 24–48 hour cancellation windows allow speculators to book and cancel freely, tying up your inventory. Tighten cancellation policies for World Cup dates to non-refundable or 14–21 day advance cancellation. This protects you from wash and ensures committed occupancy.

Here’s how to align your pricing cadence with actual World Cup booking behavior, stage by stage:
Managing booking window compression across a 39-day, 104-match tournament is not something a weekly spreadsheet review can handle. This is exactly the kind of rapidly shifting environment that RevEVOLVE’s BI platform was built for.
RevEVOLVE’s Booking Pace Analysis tracks 1-day, 3-day, and 7-day pickup at the segment level, with automated alerts when pace variance changes significantly. During the World Cup, this means you’ll see the booking surge the moment it begins — not three days later when you open your morning report.
The platform’s AI Demand Forecasting Engine uses a 5-signal ensemble model that dynamically shifts weight based on lead time. Close-in dates (0–7 days out) rely 50% on pickup velocity and 25% on pace momentum — exactly the signals that matter most during knockout round compression. This means RevEVOLVE’s forecasts adapt in real-time as World Cup results reshape demand, instead of relying on historical patterns from a year that had no World Cup.
For revenue management companies managing 20, 40, or 60 properties across multiple host and spillover markets, RevEVOLVE’s Portfolio Dashboard provides a single view of booking pace, competitive positioning, and pricing signals across every property. When Argentina advances and Kansas City’s compression triggers, your entire team sees it simultaneously — and the RM Copilot can surface specific rate recommendations for each affected hotel.
The single most important thing to understand about World Cup hotel demand is this: it arrives later than you expect, faster than you’re prepared for, and at higher price points than your STLY data suggests. Every major tournament has confirmed this pattern.
If your current pace report is showing single-digit OTB for June and July 2026, don’t panic. Instead, prepare. Set your rate floors, protect your inventory, tighten your cancellation policies, and build a match-by-match pricing strategy that accounts for the demand tier and booking window of each specific date.
Before deciding how aggressively to price into late demand, it’s important to understand how much inventory should even be exposed to the market in the first place. If you haven’t read it yet,
Inventory Protection for World Cup 2026: How Early Is Too Early for Hotel Pricing? explains why releasing too much inventory too soon can limit your upside and how disciplined control sets you up for late-stage pricing power.
The hotels that will achieve record RevPAR this summer won’t be the ones that filled up first. They’ll be the ones that held their nerve, protected their best inventory, and priced aggressively into the late booking surge.
Next in this series: Blog 5: City Deep Dive — Los Angeles (Opening Match Pricing) — a match-by-match revenue strategy for SoFi Stadium dates including the USA opener on June 12.
Q1. What is booking window compression during a World Cup?
Booking window compression is the phenomenon where the average lead time between reservation and arrival shrinks significantly during mega sporting events like the FIFA World Cup. In a normal market, leisure guests might book 30–60 days out. During a World Cup, group stage bookings typically arrive 14–30 days out, while knockout round bookings compress to 3–10 days. This happens because fans wait for ticket confirmations and team advancement results before committing to travel.
Q2. Why is my OTB occupancy so low for World Cup dates in 2026?
Low OTB occupancy 4–6 months before a World Cup is expected and consistent with prior tournaments. As of early 2026, most U.S. host cities still show single-digit OTB for tournament dates. This is because fans are waiting for ticket allocation phases to complete, many hotels are holding inventory behind LOS restrictions, and international fans face visa and travel planning delays. The primary booking surge is still ahead. Do not drop rates in response to low OTB at this lead time.
Q3. How should hotels price differently for group stage vs. knockout stage matches?
Group stage matches have longer booking windows (14–30 days) and demand levels that vary significantly by matchup. Hotels should set demand-tier pricing — EXTREME demand matches (USA, Argentina, Brazil, England) warrant premium rates, while lower-profile group matches may need flexible pricing. For knockout rounds, booking windows compress to under 10 days and price sensitivity drops sharply. Hotels should hold 10–15% of premium inventory for the final 3–5 day booking window, pricing it at absolute peak rates.
Q4. What is a spillover market and how does it benefit during the World Cup?
A spillover market is a city or submarket near a host city that absorbs overflow demand when the host city approaches sellout or overprices. Examples include Philadelphia for New York/NJ, Fort Worth for Dallas, Fort Lauderdale for Miami, and Overland Park for Kansas City. Spillover demand typically surges inside 14 days to arrival when the host city’s available inventory tightens. Hotels in spillover markets can see ADR uplifts of 20–45% during these windows.
Q5. How can AI-powered tools help manage World Cup booking window compression?
AI-powered revenue management platforms like RevEVOLVE track booking pace and pickup velocity in real-time, with automated alerts when demand patterns shift. During a World Cup, this means detecting booking surges within hours rather than days. The AI forecasting engine dynamically adjusts signal weights based on lead time — prioritizing pickup velocity for close-in dates rather than relying on historical patterns. For portfolio operators managing multiple properties across host and spillover cities, a centralized dashboard provides visibility into compression patterns across all markets simultaneously.
Share onHarry Sheta is a hospitality technology entrepreneur focused on helping hotels make faster, smarter revenue decisions. As Co-Founder of Hotel Switchboard and the driving force behind RevEVOLVE, he works closely with hoteliers, revenue managers, and management companies to modernize how pricing, forecasting, and portfolio insights are delivered.
Revenue Management 26 Mar 2026
Revenue Management 09 Mar 2026
AI-Driven Strategy 03 Mar 2026
Market Insights 16 Feb 2026
Revenue Management 30 Jan 2026
Revenue Management 27 Jan 2026
Revenue Management 19 Jan 2026
Revenue Management 12 Jan 2026
Revenue Management 29 Dec 2025
Revenue Management 19 Dec 2025
The next evolution in hotel revenue management isn’t a faster dashboard or a smarter pricing algorithm – it’s an AI…
Hotel revenue management in 2026 is defined by three fundamental shifts: AI-powered demand forecasting now achieves accuracy rates exceeding 90%,…
Los Angeles will host eight FIFA World Cup 2026 matches at SoFi Stadium, including the USA’s opening match against Paraguay…
Join the ranks of successful hoteliers who are leveraging AI to maximize their revenue. Get started today and see the difference our solution can make.